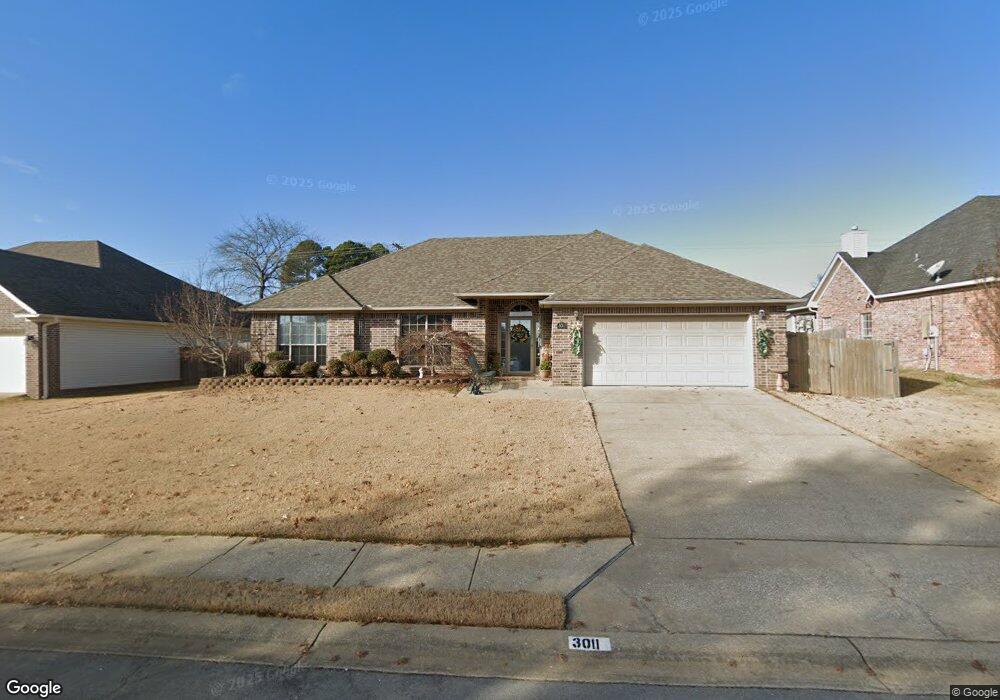
3011 Twilight Cove Bryant, AR 72022
Estimated Value: $249,208 - $275,000
3
Beds
2
Baths
1,741
Sq Ft
$151/Sq Ft
Est. Value
About This Home
This home is located at 3011 Twilight Cove, Bryant, AR 72022 and is currently estimated at $262,052, approximately $150 per square foot. 3011 Twilight Cove is a home located in Saline County with nearby schools including Collegeville Elementary School, Bryant Middle School, and Bethel Middle School.
Ownership History
Date
Name
Owned For
Owner Type
Purchase Details
Closed on
Sep 23, 2016
Sold by
Cochran Marsha G
Bought by
The Marsha G Cochran Living Trust
Current Estimated Value
Purchase Details
Closed on
Nov 14, 2014
Sold by
Johnson Culson W
Bought by
Cochran Marsha G
Home Financials for this Owner
Home Financials are based on the most recent Mortgage that was taken out on this home.
Original Mortgage
$130,000
Outstanding Balance
$100,096
Interest Rate
4.14%
Mortgage Type
New Conventional
Estimated Equity
$161,956
Purchase Details
Closed on
Sep 23, 2011
Sold by
Mills Kevin N and Mills Stephanie D
Bought by
Johnson Culson W
Home Financials for this Owner
Home Financials are based on the most recent Mortgage that was taken out on this home.
Original Mortgage
$158,565
Interest Rate
4.14%
Mortgage Type
VA
Purchase Details
Closed on
Dec 11, 2001
Bought by
Mills
Purchase Details
Closed on
Mar 19, 2001
Bought by
Everhart Homes
Create a Home Valuation Report for This Property
The Home Valuation Report is an in-depth analysis detailing your home's value as well as a comparison with similar homes in the area
Home Values in the Area
Average Home Value in this Area
Purchase History
| Date | Buyer | Sale Price | Title Company |
|---|---|---|---|
| The Marsha G Cochran Living Trust | -- | None Available | |
| Cochran Marsha G | $169,900 | American Abstract & Title Co | |
| Johnson Culson W | -- | None Available | |
| Mills | $128,500 | -- | |
| Everhart Homes | $25,000 | -- |
Source: Public Records
Mortgage History
| Date | Status | Borrower | Loan Amount |
|---|---|---|---|
| Open | Cochran Marsha G | $130,000 | |
| Previous Owner | Johnson Culson W | $158,565 |
Source: Public Records
Tax History Compared to Growth
Tax History
| Year | Tax Paid | Tax Assessment Tax Assessment Total Assessment is a certain percentage of the fair market value that is determined by local assessors to be the total taxable value of land and additions on the property. | Land | Improvement |
|---|---|---|---|---|
| 2025 | $1,750 | $39,987 | $9,300 | $30,687 |
| 2024 | $1,596 | $39,987 | $9,300 | $30,687 |
| 2023 | $1,325 | $39,987 | $9,300 | $30,687 |
| 2022 | $1,332 | $39,987 | $9,300 | $30,687 |
| 2021 | $1,339 | $33,060 | $7,200 | $25,860 |
| 2020 | $1,339 | $33,060 | $7,200 | $25,860 |
| 2019 | $1,339 | $33,060 | $7,200 | $25,860 |
| 2018 | $1,364 | $33,060 | $7,200 | $25,860 |
| 2017 | $1,364 | $33,060 | $7,200 | $25,860 |
| 2016 | $1,596 | $32,710 | $7,200 | $25,510 |
| 2015 | $1,246 | $32,710 | $7,200 | $25,510 |
| 2014 | $1,246 | $32,710 | $7,200 | $25,510 |
Source: Public Records
Map
Nearby Homes
- 2918 Forest Dr
- 3211 Moonlighting Place
- 3212 Moonlighting Place
- 2902 Andrew Dr
- 3114 Ozark Dr
- 3419 Forest Dr
- 3626 Independence Dr
- 1906 Pine Cir
- 3401 Vicki Dr
- 3516 Vicki Dr
- 4215 Stillman Loop
- 2913 Springhill Rd
- 2506 W Robinhood Dr
- 418 Suncrest St
- 3924 Commonwealth Dr
- 4040 Robinwood Cir
- TBD Springhill Rd
- 3908 Robinwood Cir
- 221 A St
- 2508 Hurricane Gardens Dr
- 3007 Twilight Cove
- 3013 Twilight Cove
- 3026 Forest Dr
- 3020 Forest Dr
- 3030 Forest Dr
- 1309 Ashlea Place Dr
- 3010 Twilight Cove
- 3006 Twilight Cove
- 3014 Forest Dr
- 3001 Twilight Cove
- 3101 Moonlighting Place Dr
- 1303 Ashlea Place Dr
- 3106 Forest Dr
- 3008 Forest Dr
- 1308 Ashlea Place Dr
- 3002 Twilight Cove
- 3000 Twilight Cove
- 3025 Forest Dr
- 3009 Sunset Meadows Dr
- 3017 Forest Dr