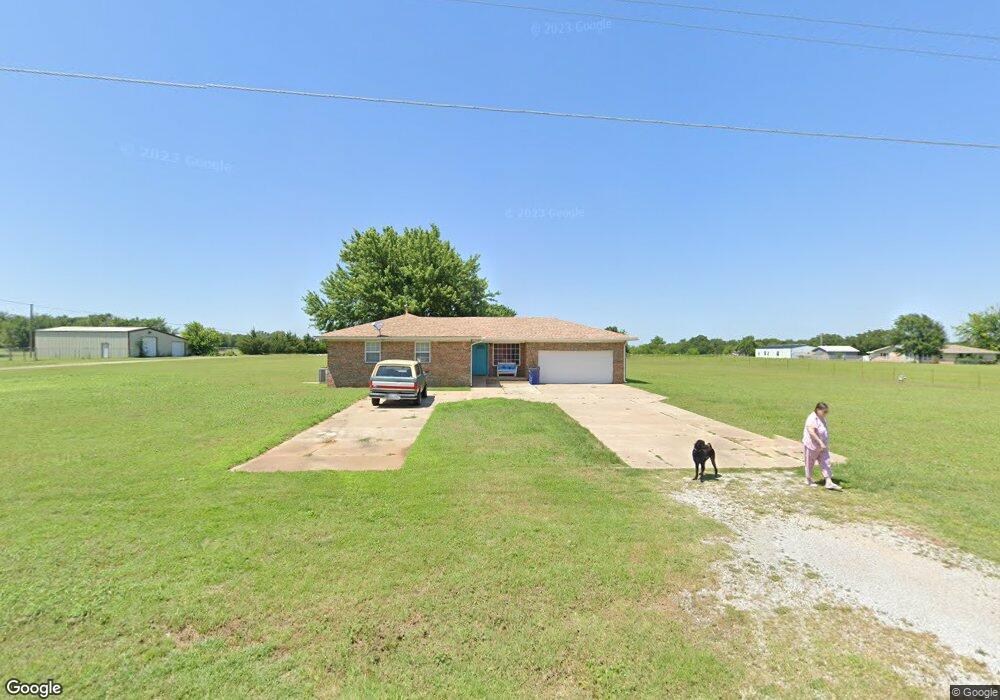
3011 W Gatlin Rd Duncan, OK 73533
Estimated Value: $154,480 - $222,000
3
Beds
2
Baths
1,384
Sq Ft
$144/Sq Ft
Est. Value
About This Home
This home is located at 3011 W Gatlin Rd, Duncan, OK 73533 and is currently estimated at $198,870, approximately $143 per square foot. 3011 W Gatlin Rd is a home located in Stephens County with nearby schools including Marlow Elementary School, Marlow Middle School, and Marlow High School.
Ownership History
Date
Name
Owned For
Owner Type
Purchase Details
Closed on
Sep 14, 2006
Sold by
Shrope Deborah June
Bought by
Shrope Deborah June and Shrope Debbie
Current Estimated Value
Home Financials for this Owner
Home Financials are based on the most recent Mortgage that was taken out on this home.
Original Mortgage
$77,500
Outstanding Balance
$45,895
Interest Rate
6.51%
Mortgage Type
Purchase Money Mortgage
Estimated Equity
$152,975
Purchase Details
Closed on
Apr 12, 2006
Sold by
Shrope David F and Shrope Deborah J
Bought by
Shrope Deborah June and Deborah June Shrope Revocable Living Tru
Purchase Details
Closed on
Jul 7, 2003
Sold by
Kerly Wilma Joy
Purchase Details
Closed on
May 20, 2002
Sold by
Kerley Walter J and Kerley Joy
Create a Home Valuation Report for This Property
The Home Valuation Report is an in-depth analysis detailing your home's value as well as a comparison with similar homes in the area
Home Values in the Area
Average Home Value in this Area
Purchase History
| Date | Buyer | Sale Price | Title Company |
|---|---|---|---|
| Shrope Deborah June | -- | Oklahoma Land Title | |
| Shrope Deborah June | -- | None Available | |
| -- | $65,000 | -- | |
| -- | -- | -- |
Source: Public Records
Mortgage History
| Date | Status | Borrower | Loan Amount |
|---|---|---|---|
| Open | Shrope Deborah June | $77,500 |
Source: Public Records
Tax History Compared to Growth
Tax History
| Year | Tax Paid | Tax Assessment Tax Assessment Total Assessment is a certain percentage of the fair market value that is determined by local assessors to be the total taxable value of land and additions on the property. | Land | Improvement |
|---|---|---|---|---|
| 2025 | -- | $10,302 | $996 | $9,306 |
| 2024 | -- | $10,298 | $996 | $9,302 |
| 2023 | $0 | $10,297 | $996 | $9,301 |
| 2022 | $0 | $9,997 | $996 | $9,001 |
| 2021 | $78 | $9,423 | $996 | $8,427 |
| 2020 | $78 | $9,153 | $996 | $8,157 |
| 2019 | $535 | $8,886 | $996 | $7,890 |
| 2018 | $0 | $8,886 | $996 | $7,890 |
| 2017 | -- | $8,628 | $996 | $7,632 |
| 2016 | $535 | $8,132 | $996 | $7,136 |
| 2015 | $535 | $7,896 | $996 | $6,900 |
| 2014 | $535 | $7,666 | $996 | $6,670 |
Source: Public Records
Map
Nearby Homes
- ???? Gatlin
- 280785 Scissortail Dr
- 4179 W Gatlin Rd
- 161616 N Highway 81
- 0 N 44th St
- 280979 Shamrock Rd
- 279389 State Highway 7
- E Gatlin Rd Unit Marlow OK 73055
- 1060 W Osage Rd
- 1100 W Osage Rd
- 2810 S Highway 81
- 1015 1015 W Camelback
- 0 Clear Springs Dr
- 3412 Fox Hollow Rd
- 4590 N 5th St
- 0 N 5th St
- 610 E Osage Rd
- 3005 W Foxboro
- 520 Walnut Hill Dr
- 1209 Bent Tree St