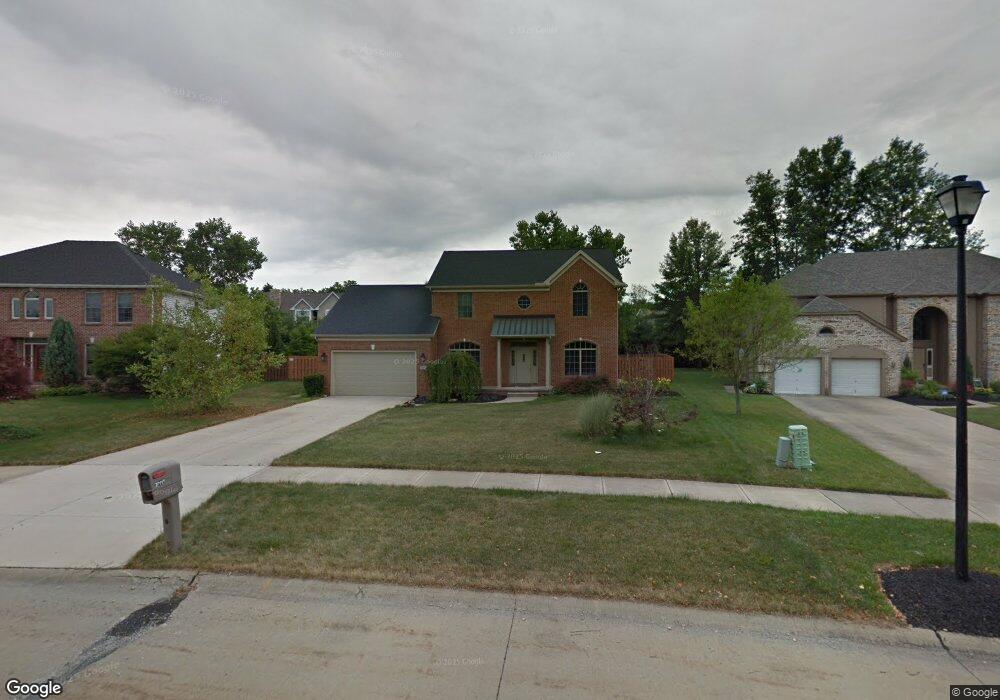
30117 Greenview Pkwy Westlake, OH 44145
Estimated Value: $582,000 - $727,000
4
Beds
3
Baths
2,850
Sq Ft
$219/Sq Ft
Est. Value
About This Home
This home is located at 30117 Greenview Pkwy, Westlake, OH 44145 and is currently estimated at $622,842, approximately $218 per square foot. 30117 Greenview Pkwy is a home located in Cuyahoga County with nearby schools including Dover Intermediate School, Lee Burneson Middle School, and Westlake High School.
Ownership History
Date
Name
Owned For
Owner Type
Purchase Details
Closed on
Jan 8, 2009
Sold by
Southstar Iv Llc
Bought by
Sasinka Dennis J and Sasinka Tomoka J
Current Estimated Value
Home Financials for this Owner
Home Financials are based on the most recent Mortgage that was taken out on this home.
Original Mortgage
$246,500
Interest Rate
4.91%
Mortgage Type
Purchase Money Mortgage
Purchase Details
Closed on
Aug 30, 2008
Sold by
Schneider Paul K and Schneider Eftychia
Bought by
Southstar Iv Llc
Purchase Details
Closed on
May 12, 2006
Sold by
Insight Builders Inc
Bought by
Schneider Paul K
Purchase Details
Closed on
Jun 21, 2002
Sold by
Pandis Alice
Bought by
Insight Builders Inc
Purchase Details
Closed on
Aug 28, 1997
Sold by
Sheriff Of Cuyahoga Coun
Bought by
Covenant Dev Inc Trustee
Purchase Details
Closed on
Jan 1, 1991
Bought by
Schneider Paul K and Schneider E
Create a Home Valuation Report for This Property
The Home Valuation Report is an in-depth analysis detailing your home's value as well as a comparison with similar homes in the area
Home Values in the Area
Average Home Value in this Area
Purchase History
| Date | Buyer | Sale Price | Title Company |
|---|---|---|---|
| Sasinka Dennis J | $275,000 | Resource Title Agency Inc | |
| Southstar Iv Llc | $213,334 | Attorney | |
| Schneider Paul K | -- | Renaissance Title | |
| Insight Builders Inc | $87,500 | Lawyers Title Ins Corp | |
| Covenant Dev Inc Trustee | $193,334 | -- | |
| Schneider Paul K | -- | -- |
Source: Public Records
Mortgage History
| Date | Status | Borrower | Loan Amount |
|---|---|---|---|
| Previous Owner | Sasinka Dennis J | $246,500 |
Source: Public Records
Tax History Compared to Growth
Tax History
| Year | Tax Paid | Tax Assessment Tax Assessment Total Assessment is a certain percentage of the fair market value that is determined by local assessors to be the total taxable value of land and additions on the property. | Land | Improvement |
|---|---|---|---|---|
| 2024 | $8,073 | $170,415 | $32,340 | $138,075 |
| 2023 | $7,302 | $131,780 | $27,480 | $104,300 |
| 2022 | $7,185 | $131,780 | $27,480 | $104,300 |
| 2021 | $7,194 | $131,780 | $27,480 | $104,300 |
| 2020 | $7,262 | $122,010 | $25,450 | $96,570 |
| 2019 | $7,041 | $348,600 | $72,700 | $275,900 |
| 2018 | $6,427 | $122,010 | $25,450 | $96,570 |
| 2017 | $5,844 | $94,820 | $21,250 | $73,570 |
| 2016 | $5,812 | $94,820 | $21,250 | $73,570 |
| 2015 | $5,749 | $94,820 | $21,250 | $73,570 |
| 2014 | $5,749 | $92,060 | $20,620 | $71,440 |
Source: Public Records
Map
Nearby Homes
- 30029 Shadow Creek Dr Unit 34
- 30233 Center Ridge Rd Unit 5
- S/L Y Carlton Ave
- S/L A Mallard Cove
- S/L Carlton Ave
- 30492 Carlton Ave
- 4324 Palomar Ln
- 29852 Lenox Dr
- ABBY TH Plan at Brentwood - Brentwood Townhomes
- LUCAS TH Plan at Brentwood - Brentwood Townhomes
- LIBBY TH Plan at Brentwood - Brentwood Townhomes
- 4352 Palomar Cir
- Lyon Plan at Carlton Estates
- Bourges Plan at Carlton Estates
- Deer Valley Plan at Carlton Estates
- Woodside Plan at Carlton Estates
- Willwood Plan at Carlton Estates
- Allison II Plan at Carlton Estates
- 4340 Palomar Ln
- 4340 Palomar Cir
- 30125 Greenview Pkwy
- 30083 Greenview Pkwy
- 30056 Shadow Creek Dr Unit 22
- 30048 Shadow Creek Dr
- 30032 Shadow Creek Dr Unit 25
- 30040 Shadow Creek Dr Unit 24
- 30153 Greenview Pkwy
- 30064 Shadow Creek Dr Unit 21
- 30072 Shadow Creek Dr Unit 3520
- 30049 Greenview Pkwy
- 30024 Shadow Creek Dr Unit 26
- 30016 Shadow Creek Dr Unit 27
- 30088 Shadow Creek Dr
- 30088 Shadow Creek Dr Unit 18
- 30102 Greenview Pkwy
- 30181 Greenview Pkwy
- 30130 Greenview Pkwy
- 30057 Shadow Creek Dr Unit 38
- 30041 Shadow Creek Dr
- 30049 Shadow Creek Dr