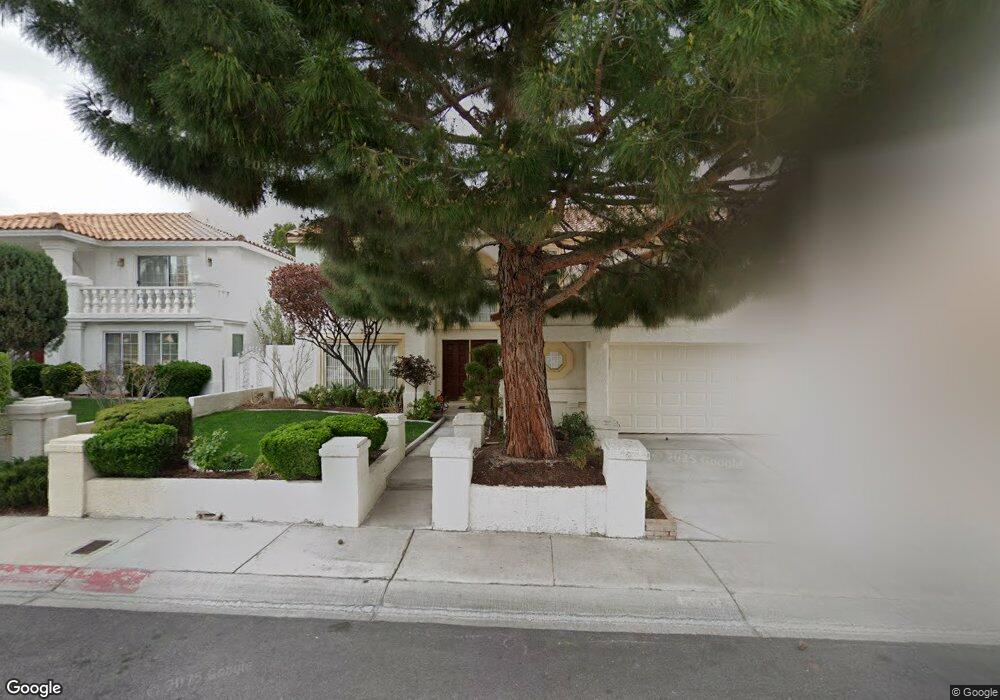
3012 High Tide Ct Unit 11B Las Vegas, NV 89117
The Section Seven NeighborhoodEstimated Value: $621,000 - $737,000
4
Beds
3
Baths
2,974
Sq Ft
$224/Sq Ft
Est. Value
About This Home
This home is located at 3012 High Tide Ct Unit 11B, Las Vegas, NV 89117 and is currently estimated at $665,504, approximately $223 per square foot. 3012 High Tide Ct Unit 11B is a home located in Clark County with nearby schools including M J Christensen Elementary School, Clifford J Lawrence Junior High School, and Bonanza High School.
Ownership History
Date
Name
Owned For
Owner Type
Purchase Details
Closed on
Nov 21, 2023
Sold by
Barnett Ronald C
Bought by
Ronald C Barnett Revocable Living Trust and Barnett
Current Estimated Value
Purchase Details
Closed on
Apr 2, 2002
Sold by
Calianno Ralph and Calianno Leslie Ann
Bought by
Barnett Ronald C and Barnett Carol E
Home Financials for this Owner
Home Financials are based on the most recent Mortgage that was taken out on this home.
Original Mortgage
$215,992
Interest Rate
6.78%
Mortgage Type
VA
Purchase Details
Closed on
Nov 30, 1999
Sold by
Turley Clifton C and Turley R S
Bought by
Calianno Ralph and Calianno Leslie Ann
Home Financials for this Owner
Home Financials are based on the most recent Mortgage that was taken out on this home.
Original Mortgage
$171,000
Interest Rate
7.95%
Create a Home Valuation Report for This Property
The Home Valuation Report is an in-depth analysis detailing your home's value as well as a comparison with similar homes in the area
Home Values in the Area
Average Home Value in this Area
Purchase History
| Date | Buyer | Sale Price | Title Company |
|---|---|---|---|
| Ronald C Barnett Revocable Living Trust | -- | None Listed On Document | |
| Barnett Ronald C | $224,050 | Nevada Title Company | |
| Calianno Ralph | $180,000 | Lawyers Title |
Source: Public Records
Mortgage History
| Date | Status | Borrower | Loan Amount |
|---|---|---|---|
| Previous Owner | Barnett Ronald C | $215,992 | |
| Previous Owner | Calianno Ralph | $171,000 |
Source: Public Records
Tax History Compared to Growth
Tax History
| Year | Tax Paid | Tax Assessment Tax Assessment Total Assessment is a certain percentage of the fair market value that is determined by local assessors to be the total taxable value of land and additions on the property. | Land | Improvement |
|---|---|---|---|---|
| 2025 | $2,867 | $133,451 | $57,050 | $76,401 |
| 2024 | $2,784 | $133,451 | $57,050 | $76,401 |
| 2023 | $2,784 | $120,825 | $47,250 | $73,575 |
| 2022 | $2,703 | $104,420 | $36,750 | $67,670 |
| 2021 | $2,625 | $101,250 | $36,400 | $64,850 |
| 2020 | $2,545 | $97,614 | $32,900 | $64,714 |
| 2019 | $2,471 | $91,279 | $26,950 | $64,329 |
| 2018 | $2,399 | $88,493 | $26,600 | $61,893 |
| 2017 | $2,885 | $87,993 | $24,850 | $63,143 |
| 2016 | $2,272 | $81,067 | $17,500 | $63,567 |
| 2015 | $2,267 | $70,636 | $16,450 | $54,186 |
| 2014 | $2,201 | $65,135 | $8,750 | $56,385 |
Source: Public Records
Map
Nearby Homes
- 3040 Ocean Port Dr
- 3009 Periscope Ct
- 9312 Angelfish Dr
- 2913 Domino Way
- 9113 Anchor Cove Ct
- 9100 Shelter Cove Ct
- 3205 Bermuda Bay St
- 9504 Cliff View Way
- 3220 Ventana Hills Dr
- 9305 Alameda Harbor Ave
- 9105 Cypress Point Way
- 9021 Feather River Ct
- 3120 Waterview Dr
- 9028 Cypress Point Way
- 9548 Wooden Pier Way
- 9013 Cypress Point Way
- 8924 Sail Bay Dr
- 9605 Blowing Sand Cir
- 2825 Waterview Dr
- 3213 Shallow Point Cir
- 3008 High Tide Ct
- 3016 High Tide Ct
- 3017 Ocean Port Dr
- 3004 High Tide Ct Unit 11B
- 3017 High Tide Ct Unit none
- 3017 High Tide Ct Unit n/a
- 3017 High Tide Ct
- 3013 Ocean Port Dr
- 3009 Ocean Port Dr
- 3013 High Tide Ct
- 3009 High Tide Ct
- 9409 Mast Dr
- 9413 Mast Dr
- 9405 Mast Dr
- 3000 High Tide Ct
- 9417 Mast Dr
- 3012 Periscope Ct
- 3001 High Tide Ct
- 9401 Mast Dr
- 3005 Ocean Port Dr