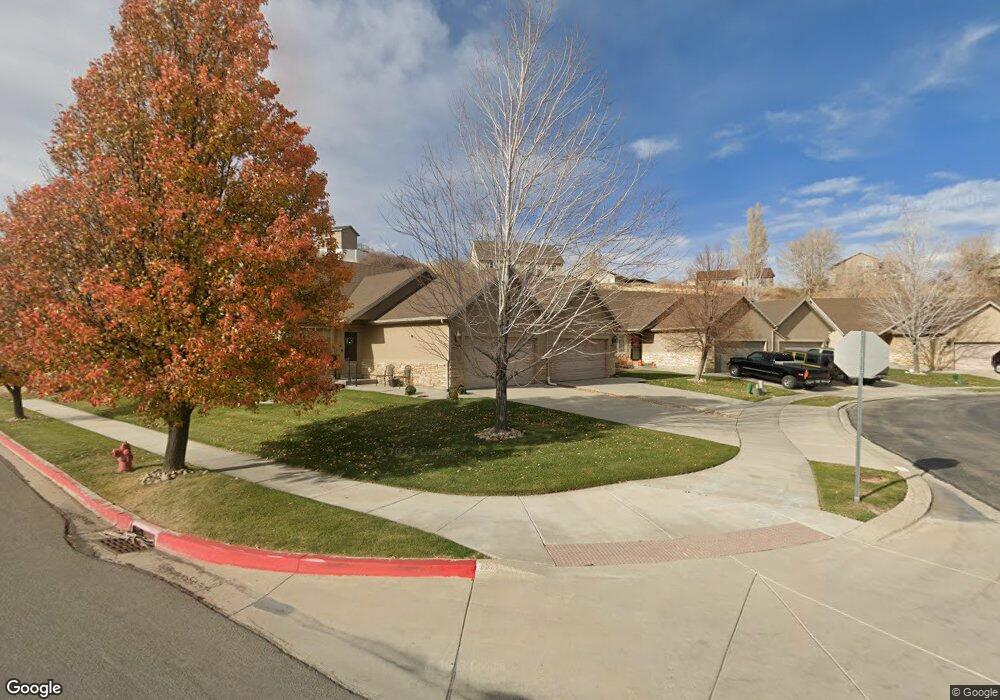
3013 E Canyon Glen Loop Spanish Fork, UT 84660
Estimated Value: $388,000 - $456,000
4
Beds
3
Baths
2,108
Sq Ft
$199/Sq Ft
Est. Value
About This Home
This home is located at 3013 E Canyon Glen Loop, Spanish Fork, UT 84660 and is currently estimated at $420,268, approximately $199 per square foot. 3013 E Canyon Glen Loop is a home located in Utah County with nearby schools including Spanish Oaks Elementary School, Diamond Fork Junior High School, and Mapleton Junior High School.
Ownership History
Date
Name
Owned For
Owner Type
Purchase Details
Closed on
Sep 1, 2021
Sold by
Coles Debora and Estate Of Marlyn Sue Mills
Bought by
Knight Travis Ethan
Current Estimated Value
Home Financials for this Owner
Home Financials are based on the most recent Mortgage that was taken out on this home.
Original Mortgage
$277,500
Outstanding Balance
$252,127
Interest Rate
2.7%
Mortgage Type
New Conventional
Estimated Equity
$168,141
Purchase Details
Closed on
Jun 26, 2014
Sold by
Daybell Brady G
Bought by
Mills Marlyn Sue
Home Financials for this Owner
Home Financials are based on the most recent Mortgage that was taken out on this home.
Original Mortgage
$81,356
Interest Rate
4.07%
Mortgage Type
New Conventional
Purchase Details
Closed on
Jan 20, 2004
Sold by
Canyon Glen Townhomes Llc
Bought by
Christensen Rick L
Create a Home Valuation Report for This Property
The Home Valuation Report is an in-depth analysis detailing your home's value as well as a comparison with similar homes in the area
Home Values in the Area
Average Home Value in this Area
Purchase History
| Date | Buyer | Sale Price | Title Company |
|---|---|---|---|
| Knight Travis Ethan | -- | Trident Title Ins Agcy Llc | |
| Mills Marlyn Sue | -- | Inwest Title | |
| Christensen Rick L | -- | Atlas Title |
Source: Public Records
Mortgage History
| Date | Status | Borrower | Loan Amount |
|---|---|---|---|
| Open | Knight Travis Ethan | $277,500 | |
| Previous Owner | Mills Marlyn Sue | $81,356 |
Source: Public Records
Tax History Compared to Growth
Tax History
| Year | Tax Paid | Tax Assessment Tax Assessment Total Assessment is a certain percentage of the fair market value that is determined by local assessors to be the total taxable value of land and additions on the property. | Land | Improvement |
|---|---|---|---|---|
| 2025 | $2,075 | $224,345 | $83,700 | $324,200 |
| 2024 | $2,075 | $213,895 | $0 | $0 |
| 2023 | $2,101 | $216,755 | $0 | $0 |
| 2022 | $1,989 | $201,245 | $0 | $0 |
| 2021 | $1,726 | $279,500 | $85,000 | $194,500 |
| 2020 | $1,629 | $256,400 | $85,000 | $171,400 |
| 2019 | $1,492 | $247,000 | $85,000 | $162,000 |
| 2018 | $1,560 | $249,700 | $85,000 | $164,700 |
| 2017 | $1,277 | $109,835 | $0 | $0 |
| 2016 | $1,179 | $100,100 | $0 | $0 |
| 2015 | $1,147 | $96,250 | $0 | $0 |
| 2014 | $967 | $81,400 | $0 | $0 |
Source: Public Records
Map
Nearby Homes
- 2968 E Canyon Meadows Dr
- 3176 E Canyon Meadows Dr
- 3176 E Canyon Meadows Dr Unit 213
- 3182 E Canyon Meadows Dr Unit 212
- 3182 E Canyon Meadows Dr
- 3194 E Canyon Meadows Dr Unit 211
- 3194 E Canyon Meadows Dr
- 3203 E Canyon Meadows Dr
- 804 E 1610 S Unit 91
- 824 E 1610 S Unit 92
- 3488 E Fairway Ln
- 3074 E Canyon Meadows Dr
- 3031 E Canyon Meadows Dr Unit 314
- 3056 E Canyon Meadows Dr Unit 330
- 3575 E River Bottoms Rd
- 3032 E Canyon Meadows Dr Unit 331
- 3093 Somerset Village Way
- 2947 E 1300 S
- 2984 E Canyon Meadows Dr
- 2972 E Canyon Meadows Dr Unit 335
- 3003 E Canyon Glen Loop
- 3033 E Canyon Glen Loop
- 3043 E Canyon Glen Loop
- 3053 E Canyon Glen Loop
- 3055 E River Bottom Rd
- 3057 E Canyon Glen Loop
- 3059 E River Bottom Rd
- 2982 E Canyon Crest Dr
- 3063 E Canyon Glen Loop
- 3065 E River Bottom Rd
- 3067 E Canyon Glen Loop
- 2976 E Canyon Crest Dr
- 3069 E River Bottom Rd
- 3073 E Canyon Glen Loop
- 3077 E Canyon Glen Loop
- 3079 E River Bottom Rd
- 2988 E Canyon Crest Dr
- 3083 E Canyon Glen Loop
- 3081 E River Bottom Rd
- 2996 E Canyon Crest Dr