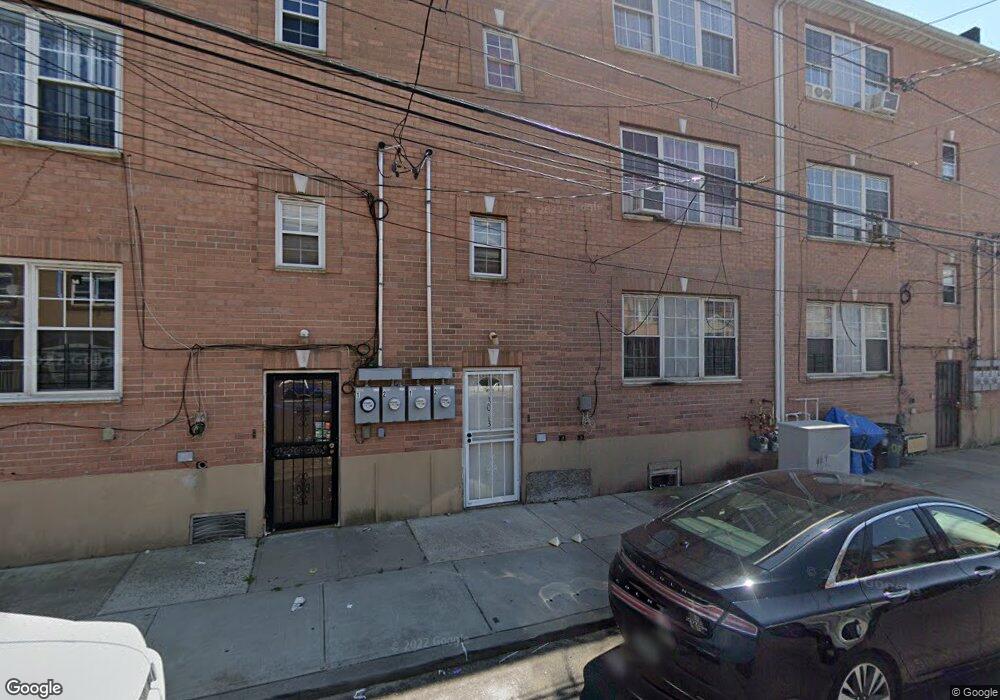
3013 Lewmay Rd Far Rockaway, NY 11691
Far Rockaway NeighborhoodEstimated Value: $587,225 - $826,000
--
Bed
--
Bath
2,637
Sq Ft
$266/Sq Ft
Est. Value
About This Home
This home is located at 3013 Lewmay Rd, Far Rockaway, NY 11691 and is currently estimated at $700,806, approximately $265 per square foot. 3013 Lewmay Rd is a home located in Queens County with nearby schools including P.S. 43, Ms 53 Brian Piccolo, and Q319 Village Academy.
Ownership History
Date
Name
Owned For
Owner Type
Purchase Details
Closed on
Aug 22, 2014
Sold by
Bridglall Mihadai
Bought by
Singh Raghunandan
Current Estimated Value
Purchase Details
Closed on
Feb 22, 2011
Sold by
Singh Dindyl
Bought by
Bridglall Mahadai
Purchase Details
Closed on
Nov 26, 2010
Sold by
Hsbc Bank Usa
Bought by
Singh Dindyal
Purchase Details
Closed on
Sep 18, 2009
Sold by
Paul A Vallone Esq Referee
Bought by
For Naac 2007-2 and Hsbc Bank Usa National Association As
Purchase Details
Closed on
Jan 5, 2007
Sold by
Beachway Properties Llc
Bought by
Clement Martine
Home Financials for this Owner
Home Financials are based on the most recent Mortgage that was taken out on this home.
Original Mortgage
$115,800
Interest Rate
6.14%
Create a Home Valuation Report for This Property
The Home Valuation Report is an in-depth analysis detailing your home's value as well as a comparison with similar homes in the area
Home Values in the Area
Average Home Value in this Area
Purchase History
| Date | Buyer | Sale Price | Title Company |
|---|---|---|---|
| Singh Raghunandan | $375,000 | -- | |
| Singh Raghunandan | $375,000 | -- | |
| Bridglall Mahadai | -- | -- | |
| Bridglall Mahadai | -- | -- | |
| Singh Dindyal | $190,000 | -- | |
| Singh Dindyal | $190,000 | -- | |
| For Naac 2007-2 | $555,763 | -- | |
| 2007-2 For Naac | $555,763 | -- | |
| Clement Martine | $579,000 | -- | |
| Clement Martine | $579,000 | -- |
Source: Public Records
Mortgage History
| Date | Status | Borrower | Loan Amount |
|---|---|---|---|
| Previous Owner | Clement Martine | $115,800 | |
| Previous Owner | Clement Martine | $463,200 |
Source: Public Records
Tax History Compared to Growth
Tax History
| Year | Tax Paid | Tax Assessment Tax Assessment Total Assessment is a certain percentage of the fair market value that is determined by local assessors to be the total taxable value of land and additions on the property. | Land | Improvement |
|---|---|---|---|---|
| 2025 | $4,564 | $22,723 | $2,534 | $20,189 |
| 2024 | $4,564 | $22,723 | $2,856 | $19,867 |
| 2023 | $4,529 | $22,550 | $3,117 | $19,433 |
| 2022 | $4,247 | $34,020 | $5,640 | $28,380 |
| 2021 | $4,224 | $31,200 | $5,640 | $25,560 |
| 2020 | $4,008 | $30,000 | $5,640 | $24,360 |
| 2019 | $3,961 | $25,680 | $5,640 | $20,040 |
| 2018 | $3,831 | $18,792 | $4,394 | $14,398 |
| 2017 | $3,614 | $17,729 | $4,444 | $13,285 |
| 2016 | $3,344 | $17,729 | $4,444 | $13,285 |
| 2015 | $2,769 | $15,780 | $4,680 | $11,100 |
| 2014 | $2,769 | $15,780 | $4,680 | $11,100 |
Source: Public Records
Map
Nearby Homes
- 171 Beach 29th St
- 3012 Seagirt Ave
- 31-08 Seagirt Ave
- 38 Marvin St
- 151 Beach 27th St
- 134 Beach 27th St
- 195 Beach 26th St
- 212 Beach 26th St
- 163 Beach 25th St
- 2711 Deerfield Rd
- 514 Beach 32nd St
- 407 Beach 35th St
- 2810 Brookhaven Ave
- 2215 Edgemere Ave
- 622 Bay 32 St
- 2412 Deerfield Rd
- 526 Grassmere Terrace
- 2918 Beach Channel Dr
- 2407 Brookhaven Ave
- 310 Beach 39th St