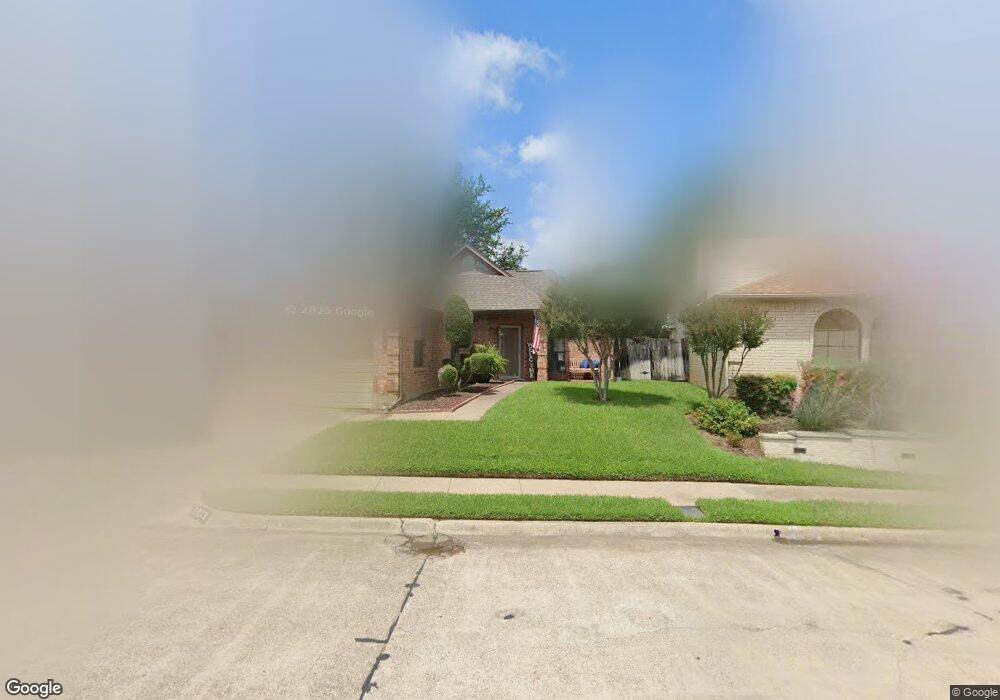
3013 Matterhorn Dr Bedford, TX 76021
Estimated Value: $321,192 - $364,000
2
Beds
2
Baths
1,538
Sq Ft
$220/Sq Ft
Est. Value
About This Home
This home is located at 3013 Matterhorn Dr, Bedford, TX 76021 and is currently estimated at $338,048, approximately $219 per square foot. 3013 Matterhorn Dr is a home located in Tarrant County with nearby schools including Bedford Heights Elementary School, Bedford Junior High School, and L.D. Bell High School.
Ownership History
Date
Name
Owned For
Owner Type
Purchase Details
Closed on
Jun 17, 2014
Sold by
Jacobs Monica A
Bought by
Kaminski Jimmy H and Kaminski Natlie A
Current Estimated Value
Purchase Details
Closed on
May 2, 2014
Sold by
Fannie Mae
Bought by
Kaminski Jimmy H and Kaminski Natlie A
Purchase Details
Closed on
Feb 10, 2014
Sold by
Bank Of America Na
Bought by
Fannie Mae and Federal National Mortgage Association
Purchase Details
Closed on
Feb 4, 2014
Sold by
Aldridge Jack S
Bought by
Bank Of America Na
Purchase Details
Closed on
Jun 10, 2008
Sold by
Good Joan Alice
Bought by
Aldridge Jack S
Home Financials for this Owner
Home Financials are based on the most recent Mortgage that was taken out on this home.
Original Mortgage
$145,350
Interest Rate
6.07%
Mortgage Type
Purchase Money Mortgage
Purchase Details
Closed on
Aug 6, 1998
Sold by
Tidwell Gerald J
Bought by
Good Joan Alice
Create a Home Valuation Report for This Property
The Home Valuation Report is an in-depth analysis detailing your home's value as well as a comparison with similar homes in the area
Home Values in the Area
Average Home Value in this Area
Purchase History
| Date | Buyer | Sale Price | Title Company |
|---|---|---|---|
| Kaminski Jimmy H | -- | None Available | |
| Kaminski Jimmy H | -- | None Available | |
| Fannie Mae | -- | None Available | |
| Bank Of America Na | -- | Servicelink | |
| Aldridge Jack S | -- | Alamo Title Company | |
| Good Joan Alice | -- | Alamo Title Co |
Source: Public Records
Mortgage History
| Date | Status | Borrower | Loan Amount |
|---|---|---|---|
| Previous Owner | Aldridge Jack S | $145,350 |
Source: Public Records
Tax History Compared to Growth
Tax History
| Year | Tax Paid | Tax Assessment Tax Assessment Total Assessment is a certain percentage of the fair market value that is determined by local assessors to be the total taxable value of land and additions on the property. | Land | Improvement |
|---|---|---|---|---|
| 2025 | $5,462 | $314,617 | $70,000 | $244,617 |
| 2024 | $5,462 | $314,617 | $70,000 | $244,617 |
| 2023 | $5,462 | $284,781 | $45,000 | $239,781 |
| 2022 | $5,646 | $258,508 | $45,000 | $213,508 |
| 2021 | $4,476 | $190,000 | $44,044 | $145,956 |
| 2020 | $4,616 | $194,125 | $45,000 | $149,125 |
| 2019 | $4,786 | $197,000 | $45,000 | $152,000 |
| 2018 | $4,754 | $195,691 | $45,000 | $150,691 |
| 2017 | $4,020 | $166,178 | $30,000 | $136,178 |
| 2016 | $3,906 | $161,472 | $30,000 | $131,472 |
| 2015 | $3,430 | $141,872 | $30,000 | $111,872 |
| 2014 | $3,430 | $136,600 | $20,000 | $116,600 |
Source: Public Records
Map
Nearby Homes
- 1401 Danielle Dr
- 2704 Shady Grove Dr
- 1013 Springdale Rd
- 2700 Shady Grove Dr
- 2901 Miles Way
- 3301 Wendover Ct
- 922 Shady Creek Ln
- 913 Kensington Ct
- 2508 Lakeview Dr
- 801 Shady Creek Ln
- 1209 Hillandale Ct
- 1636 Bedford Oaks Dr
- 2501 Shady Grove Dr
- 1704 Indian Oaks Ct
- 3119 Spring Grove Dr
- 37 Devonshire Dr
- 1630 Post Oak Dr
- 3213 Spring Valley Dr
- 2317 Shady Grove Dr
- 1109 Simpson Terrace
- 3009 Matterhorn Dr
- 3017 Matterhorn Dr
- 3005 Matterhorn Dr
- 3024 Everest Dr
- 3021 Matterhorn Dr
- 2945 Eagles Nest Dr
- 3020 Everest Dr
- 3008 Matterhorn Dr
- 3012 Matterhorn Dr
- 3004 Matterhorn Dr
- 3001 Matterhorn Dr
- 3016 Matterhorn Dr
- 2941 Eagles Nest Dr
- 3020 Matterhorn Dr
- 3000 Matterhorn Dr
- 3016 Everest Dr
- 3025 Everest Dr
- 3029 Everest Dr
- 3024 Matterhorn Dr
- 2937 Eagles Nest Dr