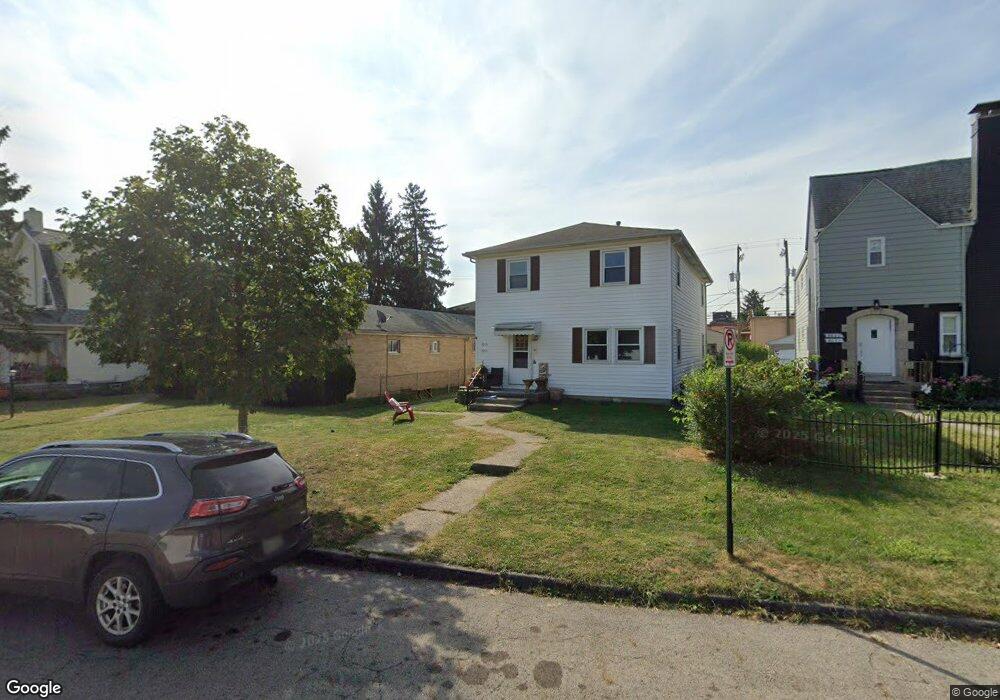
3013 Parkside Rd Unit 15 Columbus, OH 43204
Westgate NeighborhoodEstimated Value: $240,000 - $303,650
4
Beds
2
Baths
2,250
Sq Ft
$116/Sq Ft
Est. Value
About This Home
This home is located at 3013 Parkside Rd Unit 15, Columbus, OH 43204 and is currently estimated at $261,663, approximately $116 per square foot. 3013 Parkside Rd Unit 15 is a home located in Franklin County with nearby schools including Westgate Alternative Elementary School, Westmoor Middle School, and West High School.
Ownership History
Date
Name
Owned For
Owner Type
Purchase Details
Closed on
Nov 16, 2006
Sold by
Sundance Holdings Llc
Bought by
Joann Barnett Llc
Current Estimated Value
Purchase Details
Closed on
Dec 12, 2003
Sold by
Cronin Thomas A and Cronin Ann M
Bought by
Sundance Holdings Llc
Home Financials for this Owner
Home Financials are based on the most recent Mortgage that was taken out on this home.
Original Mortgage
$79,200
Interest Rate
6.04%
Mortgage Type
Purchase Money Mortgage
Purchase Details
Closed on
Jun 25, 1998
Sold by
Siemer James L and Siemer Sylvia J
Bought by
Cronin Thomas A and Cronin Ann M
Home Financials for this Owner
Home Financials are based on the most recent Mortgage that was taken out on this home.
Original Mortgage
$76,500
Interest Rate
7.27%
Purchase Details
Closed on
Oct 1, 1984
Create a Home Valuation Report for This Property
The Home Valuation Report is an in-depth analysis detailing your home's value as well as a comparison with similar homes in the area
Home Values in the Area
Average Home Value in this Area
Purchase History
| Date | Buyer | Sale Price | Title Company |
|---|---|---|---|
| Joann Barnett Llc | $110,500 | Land & Mo | |
| Sundance Holdings Llc | $99,000 | Title First Agency Inc | |
| Cronin Thomas A | $85,000 | Ohio Title Agency | |
| -- | $10,000 | -- |
Source: Public Records
Mortgage History
| Date | Status | Borrower | Loan Amount |
|---|---|---|---|
| Previous Owner | Sundance Holdings Llc | $79,200 | |
| Previous Owner | Cronin Thomas A | $76,500 |
Source: Public Records
Tax History Compared to Growth
Tax History
| Year | Tax Paid | Tax Assessment Tax Assessment Total Assessment is a certain percentage of the fair market value that is determined by local assessors to be the total taxable value of land and additions on the property. | Land | Improvement |
|---|---|---|---|---|
| 2024 | $4,086 | $89,150 | $24,190 | $64,960 |
| 2023 | $4,035 | $89,145 | $24,185 | $64,960 |
| 2022 | $2,864 | $53,900 | $12,250 | $41,650 |
| 2021 | $2,870 | $53,900 | $12,250 | $41,650 |
| 2020 | $2,874 | $53,900 | $12,250 | $41,650 |
| 2019 | $2,794 | $44,940 | $10,220 | $34,720 |
| 2018 | $2,411 | $44,940 | $10,220 | $34,720 |
| 2017 | $2,513 | $44,940 | $10,220 | $34,720 |
| 2016 | $2,233 | $32,870 | $8,230 | $24,640 |
| 2015 | $2,033 | $32,870 | $8,230 | $24,640 |
| 2014 | $2,038 | $32,870 | $8,230 | $24,640 |
| 2013 | $1,117 | $36,505 | $9,135 | $27,370 |
Source: Public Records
Map
Nearby Homes
- 457 Guernsey Ave
- 610 Salisbury Rd
- 638 Binns Blvd
- 363 S Chase Ave
- 570 Wiltshire Rd
- 438 S Powell Ave
- 327 S Chase Ave
- 725 Binns Blvd
- 638 Wiltshire Rd
- 339 S Powell Ave
- 586 S Hague Ave
- 406 S Hague Ave Unit 6
- 2845 Fremont St
- 267 S Westgate Ave
- 3276-3278 Sullivant Ave
- 0 S Brinker Ave
- 261 S Chase Ave
- 690 S Hague Ave
- 389 S Harris Ave
- 3300-3302 Sullivant Ave
- 3019 Parkside Rd Unit 21
- 3007 Parkside Rd
- 3025 Parkside Rd Unit 27
- 3003 Parkside Rd
- 3031 Parkside Rd Unit 33
- 483 Binns Blvd
- 3037 Parkside Rd
- 3008 Sullivant Ave
- 486-488 S Huron Ave
- 486 S Huron Ave Unit 488
- 507 Binns Blvd
- 501 Binns Blvd
- 513 Binns Blvd
- 493 Binns Blvd
- 477 Binns Blvd
- 480-482 S Huron Ave
- 480 S Huron Ave Unit 482
- 3000 Sullivant Ave Unit 250
- 3000 Sullivant Ave
- 474 S Huron Ave Unit 476