Estimated Value: $291,282 - $305,000
3
Beds
2
Baths
1,511
Sq Ft
$197/Sq Ft
Est. Value
About This Home
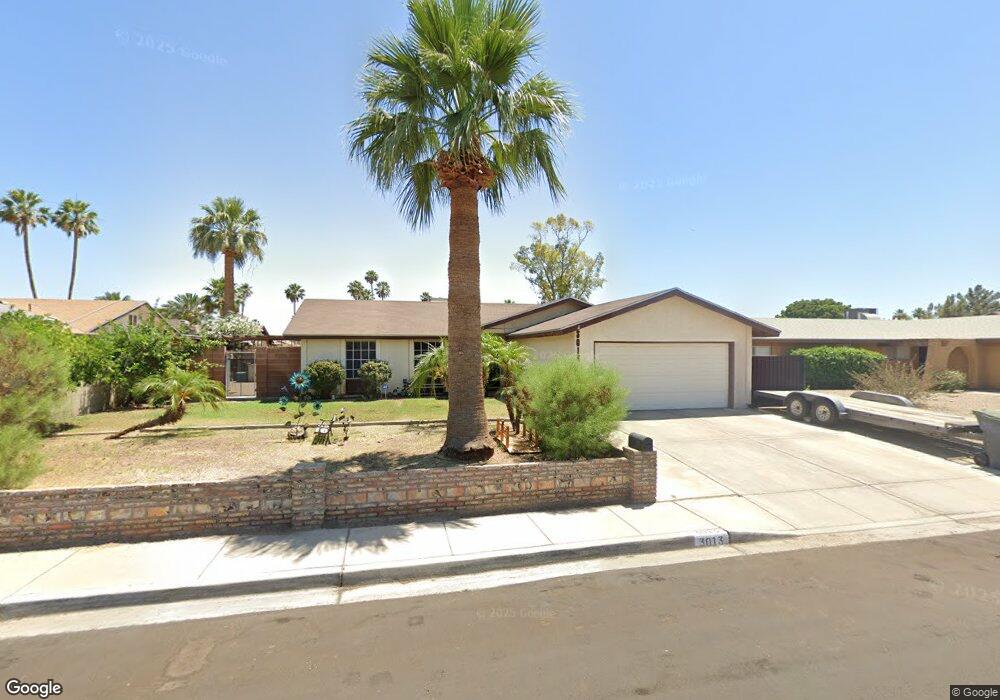
This home is located at 3013 W 18th St, Yuma, AZ 85364 and is currently estimated at $297,321, approximately $196 per square foot. 3013 W 18th St is a home located in Yuma County with nearby schools including Pueblo Elementary School, Centennial Middle School, and Cibola High School.
Ownership History
Date
Name
Owned For
Owner Type
Purchase Details
Closed on
Jul 12, 2010
Sold by
Becerra Daniel and Castro Maria P
Bought by
Garibay Arturo
Current Estimated Value
Home Financials for this Owner
Home Financials are based on the most recent Mortgage that was taken out on this home.
Original Mortgage
$105,304
Outstanding Balance
$69,941
Interest Rate
4.71%
Mortgage Type
FHA
Estimated Equity
$227,380
Purchase Details
Closed on
Nov 27, 2006
Sold by
Rathbun David and Rathbun Amy
Bought by
Becerra Daniel and Castro Patricia
Home Financials for this Owner
Home Financials are based on the most recent Mortgage that was taken out on this home.
Original Mortgage
$148,000
Interest Rate
8.45%
Mortgage Type
Balloon
Purchase Details
Closed on
Jan 20, 2006
Sold by
Kogut Kathleen Anne
Bought by
Rathbun David and Rathbun Amy
Create a Home Valuation Report for This Property
The Home Valuation Report is an in-depth analysis detailing your home's value as well as a comparison with similar homes in the area
Home Values in the Area
Average Home Value in this Area
Purchase History
| Date | Buyer | Sale Price | Title Company |
|---|---|---|---|
| Garibay Arturo | $106,723 | First American Title | |
| Becerra Daniel | $185,000 | Yuma Title | |
| Rathbun David | $160,000 | Citizens Title |
Source: Public Records
Mortgage History
| Date | Status | Borrower | Loan Amount |
|---|---|---|---|
| Open | Garibay Arturo | $105,304 | |
| Previous Owner | Becerra Daniel | $148,000 | |
| Closed | Becerra Daniel | $37,000 |
Source: Public Records
Tax History Compared to Growth
Tax History
| Year | Tax Paid | Tax Assessment Tax Assessment Total Assessment is a certain percentage of the fair market value that is determined by local assessors to be the total taxable value of land and additions on the property. | Land | Improvement |
|---|---|---|---|---|
| 2025 | $2,087 | $16,607 | $3,906 | $12,701 |
| 2024 | $2,001 | $15,817 | $3,935 | $11,882 |
| 2023 | $2,001 | $15,063 | $3,722 | $11,341 |
| 2022 | $1,945 | $14,345 | $3,779 | $10,566 |
| 2021 | $2,007 | $13,663 | $3,395 | $10,268 |
| 2020 | $1,952 | $13,012 | $3,735 | $9,277 |
| 2019 | $1,920 | $12,392 | $3,895 | $8,497 |
| 2018 | $1,794 | $11,802 | $3,539 | $8,263 |
| 2017 | $1,758 | $11,802 | $3,539 | $8,263 |
| 2016 | $1,722 | $10,705 | $3,625 | $7,080 |
| 2015 | $1,396 | $10,265 | $3,094 | $7,171 |
| 2014 | $1,396 | $9,776 | $2,400 | $7,376 |
Source: Public Records
Map
Nearby Homes
- 3219 W Rome St
- 3017 W 17th St
- 1721 S Athens Ave
- 3120 W 16th Place
- 1937 S London Dr
- 1909 S Athens Ave
- 1603 S 31st Dr
- 0000 W 16th St
- 3435 W 18th Place
- 2545 W 16th St
- 3575 W 16th Ln
- 1887 S Mckinley Ave
- 2460 W Del Oro Ln
- 3533 W 15th St
- 2229 W 17th St
- 2238 W Brook St
- 3411 W 21st St
- 2332 W Del Oro Ln
- 2556 W 14th St
- 1440 S 35th Ave
- 3027 W 18th St
- 3001 W 18th St
- 3012 W Rome St
- 3026 W Rome St
- 2978 W Rome St
- 3051 W 18th St
- 3014 W 18th St
- 3028 W 18th St
- 3002 W 18th St
- 3050 W Rome St
- 3052 W 18 St
- 3052 W 18th St
- 3075 W 18th St
- 1809 S Naples Ave
- 1801 S Naples Ave
- 3074 W Rome St
- 1817 S Naples Ave
- 3015 W 17th Place
- 3029 W 17th Place
- 2979 W Rome St