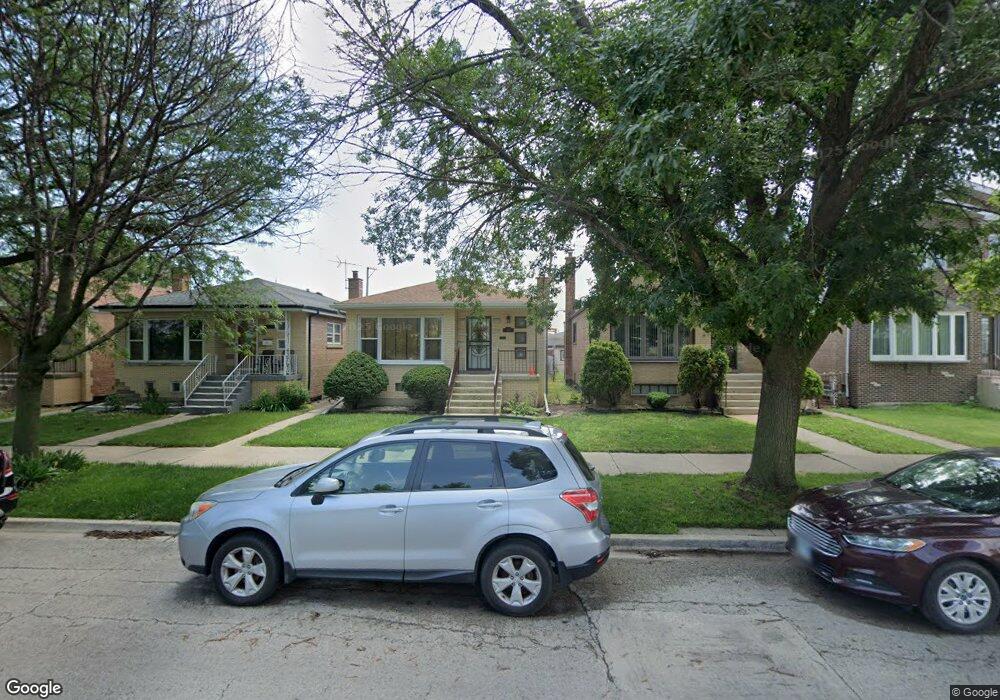
3013 W 77th St Chicago, IL 60652
Ashburn NeighborhoodEstimated Value: $244,000 - $310,000
3
Beds
2
Baths
1,080
Sq Ft
$255/Sq Ft
Est. Value
About This Home
This home is located at 3013 W 77th St, Chicago, IL 60652 and is currently estimated at $275,574, approximately $255 per square foot. 3013 W 77th St is a home located in Cook County with nearby schools including Hampton Elementary Fine & Perf Arts School, Bogan Computer Technical High School, and CICS - Wrightwood.
Ownership History
Date
Name
Owned For
Owner Type
Purchase Details
Closed on
Jul 10, 2010
Sold by
Prasad Gayatri and Prasad Kailash
Bought by
Chatmon Desiree
Current Estimated Value
Home Financials for this Owner
Home Financials are based on the most recent Mortgage that was taken out on this home.
Original Mortgage
$148,401
Outstanding Balance
$101,637
Interest Rate
5.58%
Mortgage Type
Unknown
Estimated Equity
$173,937
Purchase Details
Closed on
Feb 19, 2010
Sold by
Federal Home Loan Mortgage Corporation
Bought by
Prasad Gayatri
Purchase Details
Closed on
Nov 23, 2009
Sold by
Dyson James E
Bought by
Federal Home Loan Mortgage Corp
Purchase Details
Closed on
Oct 2, 1997
Sold by
Suchor Claudia A and Kral Paula
Bought by
Dyson James E
Home Financials for this Owner
Home Financials are based on the most recent Mortgage that was taken out on this home.
Original Mortgage
$87,321
Interest Rate
7.7%
Mortgage Type
FHA
Create a Home Valuation Report for This Property
The Home Valuation Report is an in-depth analysis detailing your home's value as well as a comparison with similar homes in the area
Home Values in the Area
Average Home Value in this Area
Purchase History
| Date | Buyer | Sale Price | Title Company |
|---|---|---|---|
| Chatmon Desiree | $150,000 | Fidelity National Title | |
| Prasad Gayatri | $66,000 | Attorneys Title Guaranty Fun | |
| Federal Home Loan Mortgage Corp | -- | None Available | |
| Dyson James E | $58,666 | -- |
Source: Public Records
Mortgage History
| Date | Status | Borrower | Loan Amount |
|---|---|---|---|
| Open | Chatmon Desiree | $148,401 | |
| Previous Owner | Dyson James E | $87,321 |
Source: Public Records
Tax History
| Year | Tax Paid | Tax Assessment Tax Assessment Total Assessment is a certain percentage of the fair market value that is determined by local assessors to be the total taxable value of land and additions on the property. | Land | Improvement |
|---|---|---|---|---|
| 2025 | $1,574 | $19,000 | $2,250 | $16,750 |
| 2024 | $1,574 | $19,000 | $2,250 | $16,750 |
| 2023 | $2,247 | $17,000 | $3,000 | $14,000 |
| 2022 | $2,247 | $17,000 | $3,000 | $14,000 |
| 2021 | $2,231 | $17,000 | $3,000 | $14,000 |
| 2020 | $2,115 | $12,513 | $3,000 | $9,513 |
| 2019 | $2,123 | $13,904 | $3,000 | $10,904 |
| 2018 | $2,086 | $13,904 | $3,000 | $10,904 |
| 2017 | $2,283 | $13,883 | $2,625 | $11,258 |
| 2016 | $2,301 | $13,883 | $2,625 | $11,258 |
| 2015 | $2,083 | $13,883 | $2,625 | $11,258 |
| 2014 | $1,808 | $12,215 | $2,437 | $9,778 |
| 2013 | $1,761 | $12,215 | $2,437 | $9,778 |
Source: Public Records
Map
Nearby Homes
- 2964 W Columbus Ave
- 3053 W 77th St
- 7726 S Troy St
- 7901 S Whipple St
- 7900 S Richmond St
- 7733 S Sawyer Ave
- 7925 S Richmond St
- 7701 S Christiana Ave
- 8022 S Albany Ave
- 7826 S Christiana Ave
- 7805 S Homan Ave
- 7328 S Albany Ave
- 8025 S Mozart St
- 7326 S Francisco Ave
- 8026 S Fairfield Ave
- 7317 S Mozart St
- 7944 S Talman Ave
- 7952 S Trumbull Ave
- 7448 S Maplewood Ave
- 2811 W 82nd St
- 3009 W 77th St
- 3015 W 77th St
- 3007 W 77th St
- 3019 W 77th St
- 3021 W 77th St
- 3003 W 77th St
- 3025 W 77th St
- 3001 W 77th St
- 7717 S Whipple St
- 2976 W Columbus Ave
- 2972 W Columbus Ave
- 3002 W Columbus Ave
- 2970 W Columbus Ave
- 3004 W Columbus Ave
- 2968 W Columbus Ave
- 3006 W Columbus Ave
- 2966 W Columbus Ave
- 3010 W Columbus Ave
- 3035 W 77th St
- 3012 W Columbus Ave
Your Personal Tour Guide
Ask me questions while you tour the home.