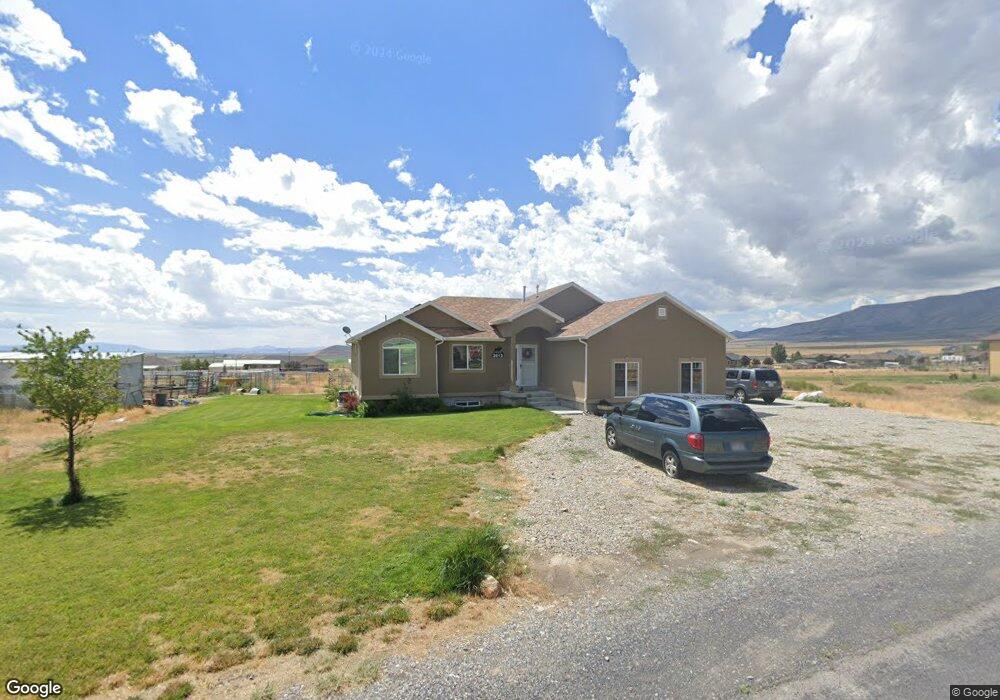
3013 W Deer Run Dr Unit 20 Stockton, UT 84071
Estimated Value: $609,000 - $698,000
--
Bed
--
Bath
3,116
Sq Ft
$204/Sq Ft
Est. Value
About This Home
This home is located at 3013 W Deer Run Dr Unit 20, Stockton, UT 84071 and is currently estimated at $636,418, approximately $204 per square foot. 3013 W Deer Run Dr Unit 20 is a home located in Tooele County with nearby schools including Settlement Canyon Elementary School and Dugway.
Ownership History
Date
Name
Owned For
Owner Type
Purchase Details
Closed on
Nov 3, 2014
Sold by
Champneys Coby Gordon and Champneys Nicole Dawn
Bought by
Champneys Coby G and Champneys Nicole D
Current Estimated Value
Home Financials for this Owner
Home Financials are based on the most recent Mortgage that was taken out on this home.
Original Mortgage
$176,607
Outstanding Balance
$136,130
Interest Rate
4.17%
Mortgage Type
New Conventional
Estimated Equity
$500,288
Purchase Details
Closed on
Dec 9, 2008
Sold by
L & B Development Co Inc
Bought by
South Rim Lc
Purchase Details
Closed on
Dec 19, 2006
Sold by
L & B Development Co Inc
Bought by
Casazza Stephen and Casazza Cheryl
Purchase Details
Closed on
Dec 13, 2006
Sold by
L & B Development Company Inc
Bought by
Adamson Paul and Adamson Lorelei
Purchase Details
Closed on
Nov 16, 2006
Sold by
L & B Development Company Inc
Bought by
Jewell Gary and Jewell Christine
Create a Home Valuation Report for This Property
The Home Valuation Report is an in-depth analysis detailing your home's value as well as a comparison with similar homes in the area
Home Values in the Area
Average Home Value in this Area
Purchase History
| Date | Buyer | Sale Price | Title Company |
|---|---|---|---|
| Champneys Coby G | -- | Security Title Ins | |
| South Rim Lc | -- | None Available | |
| Casazza Stephen | -- | First American Title Ins Age | |
| Adamson Paul | -- | First American Title Ins Age | |
| Jewell Gary | -- | First American Title Ins Age |
Source: Public Records
Mortgage History
| Date | Status | Borrower | Loan Amount |
|---|---|---|---|
| Open | Champneys Coby G | $176,607 |
Source: Public Records
Tax History Compared to Growth
Tax History
| Year | Tax Paid | Tax Assessment Tax Assessment Total Assessment is a certain percentage of the fair market value that is determined by local assessors to be the total taxable value of land and additions on the property. | Land | Improvement |
|---|---|---|---|---|
| 2025 | $3,794 | $300,806 | $124,000 | $176,806 |
| 2024 | $3,794 | $316,650 | $133,500 | $183,150 |
| 2023 | $3,794 | $302,702 | $133,500 | $169,202 |
| 2022 | $3,099 | $295,809 | $115,000 | $180,809 |
| 2021 | $2,448 | $193,440 | $53,250 | $140,190 |
| 2020 | $2,613 | $350,581 | $80,000 | $270,581 |
| 2019 | $2,411 | $306,082 | $70,000 | $236,082 |
| 2018 | $2,387 | $285,173 | $70,000 | $215,173 |
| 2017 | $1,970 | $250,325 | $70,000 | $180,325 |
| 2016 | $1,807 | $139,429 | $32,000 | $107,429 |
| 2015 | $1,807 | $139,429 | $0 | $0 |
| 2014 | -- | $50,000 | $0 | $0 |
Source: Public Records
Map
Nearby Homes
- 2912 W Rim Rock Dr
- 3214 W Ridgeline Rd
- 2692 W Rim Rock Dr Unit 910
- 2974 W Ridgeline Rd Unit 85
- 2521 W Ridgeline Rd
- 1472 S Hogans Rd
- 2423 W Cedarline Loop
- 2258 W Deer Run Dr Unit 174
- 25 W Pearson
- 1703 Copper St Unit 1277
- 0 E Bald Mountain Rd
- 50 Pine St
- 475 Utah 36
- 0 Utah 36
- 315 S Highway 199
- 311 S Highway 199
- 10550 W South Willow Canyon Rd
- 1293 N Buck Run Rd
- 120 Utah 73
- 1115 S 1010 W
- 3013 W Deer Run Dr
- 3004 W Rim Rock Dr Unit 12
- 3004 W Rim Rock Dr
- 2973 W Deer Run Dr Unit 21
- 2973 W Deer Run Dr
- 3030 W Deer Run Dr
- 3055 W Deer Run Dr Unit 19
- 3055 W Deer Run Dr
- 2998 W Deer Run Dr
- 3044 W Rim Rock Dr Unit 13
- 3044 W Rim Rock Dr
- 3062 W Deer Run Dr Unit 31
- 3062 W Deer Run Dr
- 2930 W Rim Rock Dr
- 3003 W Rim Rock Dr
- 2966 W Deer Run Dr Unit 28
- 2931 W Deer Run Dr Unit 22
- 2931 W Deer Run Dr
- 3088 W Rim Rock Dr Unit 14
- 3088 W Rim Rock Dr