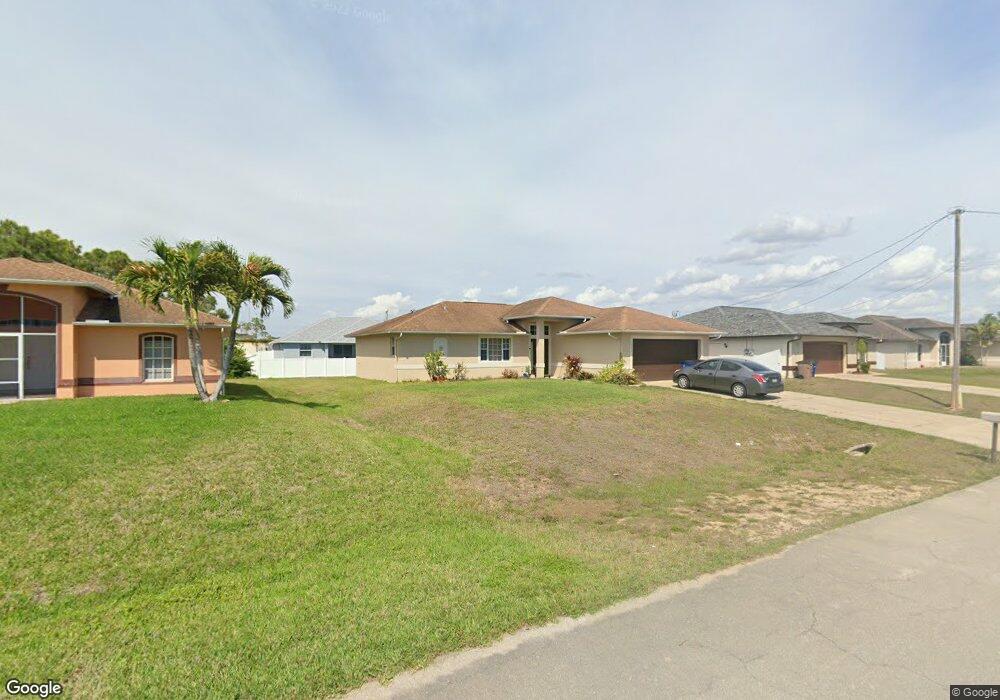
3014 3rd St W Unit 4 Lehigh Acres, FL 33971
Alabama NeighborhoodEstimated Value: $246,000 - $297,000
3
Beds
2
Baths
1,587
Sq Ft
$171/Sq Ft
Est. Value
About This Home
This home is located at 3014 3rd St W Unit 4, Lehigh Acres, FL 33971 and is currently estimated at $271,885, approximately $171 per square foot. 3014 3rd St W Unit 4 is a home located in Lee County with nearby schools including Lehigh Elementary School, Gateway Elementary School, and Tice Elementary School.
Ownership History
Date
Name
Owned For
Owner Type
Purchase Details
Closed on
Oct 19, 2016
Sold by
Oliva Pedro and Oliva Emestina
Bought by
P And E O Investments Corp
Current Estimated Value
Purchase Details
Closed on
Sep 18, 2009
Sold by
Ladwig Gordon R and Ladwig Mary
Bought by
Oliva Pedro and Oliva Ernestina
Purchase Details
Closed on
Sep 15, 2009
Sold by
Mongerard Rosemaine
Bought by
Ladwig Gordon R and Ladwig Mary
Purchase Details
Closed on
Nov 28, 2005
Sold by
Dmi Inc
Bought by
Mongerard Pierre Isaac and Mongerard Rosemaine
Home Financials for this Owner
Home Financials are based on the most recent Mortgage that was taken out on this home.
Original Mortgage
$247,500
Interest Rate
6.19%
Mortgage Type
Construction
Purchase Details
Closed on
May 7, 2004
Sold by
Usa Real Estate Solutions Llc
Bought by
Dmi Inc
Create a Home Valuation Report for This Property
The Home Valuation Report is an in-depth analysis detailing your home's value as well as a comparison with similar homes in the area
Home Values in the Area
Average Home Value in this Area
Purchase History
| Date | Buyer | Sale Price | Title Company |
|---|---|---|---|
| P And E O Investments Corp | -- | None Available | |
| Oliva Pedro | $64,900 | Florida Title One Llc | |
| Ladwig Gordon R | $44,000 | None Available | |
| Mongerard Pierre Isaac | $55,000 | Executive Title Ins Svcs Inc | |
| Dmi Inc | -- | Fidelity National Title Ins |
Source: Public Records
Mortgage History
| Date | Status | Borrower | Loan Amount |
|---|---|---|---|
| Previous Owner | Mongerard Pierre Isaac | $247,500 |
Source: Public Records
Tax History Compared to Growth
Tax History
| Year | Tax Paid | Tax Assessment Tax Assessment Total Assessment is a certain percentage of the fair market value that is determined by local assessors to be the total taxable value of land and additions on the property. | Land | Improvement |
|---|---|---|---|---|
| 2025 | $3,329 | $206,237 | $22,610 | $183,627 |
| 2024 | $3,329 | $203,052 | -- | -- |
| 2023 | $3,121 | $184,593 | $0 | $0 |
| 2022 | $2,848 | $167,812 | $0 | $0 |
| 2021 | $2,485 | $152,556 | $6,700 | $145,856 |
| 2020 | $2,408 | $142,930 | $5,200 | $137,730 |
| 2019 | $2,382 | $136,466 | $5,300 | $131,166 |
| 2018 | $2,250 | $125,970 | $5,000 | $120,970 |
| 2017 | $2,101 | $113,867 | $5,000 | $108,867 |
| 2016 | $1,745 | $97,792 | $5,000 | $92,792 |
| 2015 | $1,620 | $86,808 | $3,610 | $83,198 |
| 2014 | $1,381 | $72,902 | $2,715 | $70,187 |
| 2013 | -- | $62,106 | $2,700 | $59,406 |
Source: Public Records
Map
Nearby Homes
- 3016 3rd St W Unit 4
- 3010 3rd St W
- 3018 3rd St W Unit 4
- 3017 4TH ST W 4th St W
- 3015 3rd St W
- 3015 3rd St W
- 3011 4th St W
- 3019 4th St W Unit 4
- 3011 3rd St W
- 3008 3rd St W
- 3020 3rd St W Unit 4
- 3021 4th St W
- 3009 3rd St W
- 3021 3rd St W
- 3006 3rd St W
- 3012 2nd St W
- 3007 4th St W
- 3018 2nd St W
- 3010 2nd St W
- 3004 3rd St W