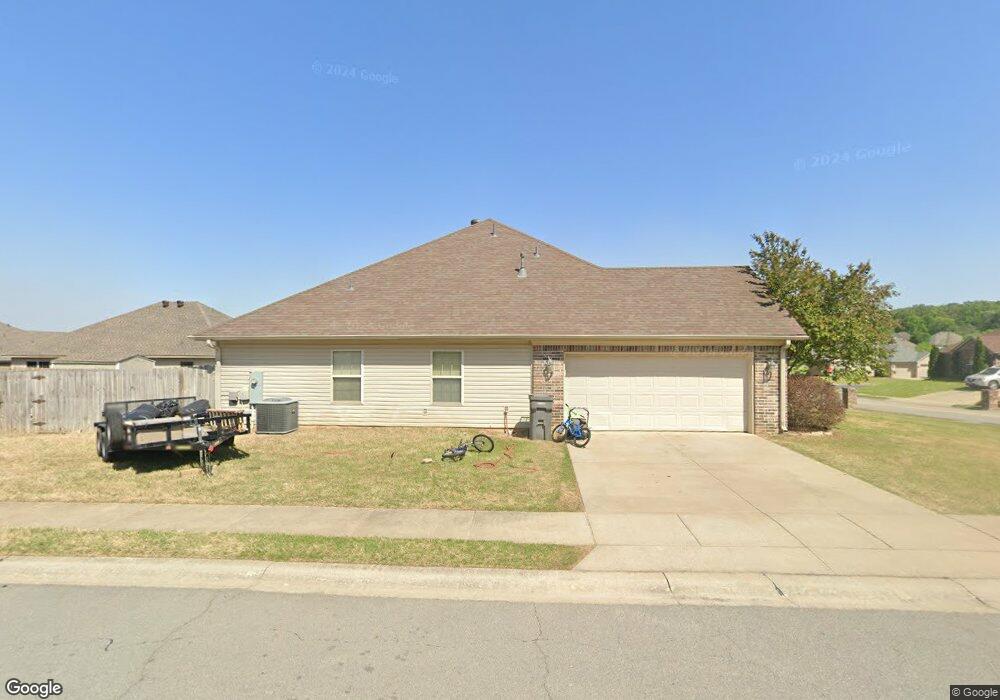
3014 Denise Dr Benton, AR 72015
Estimated Value: $278,000 - $287,000
4
Beds
2
Baths
1,873
Sq Ft
$152/Sq Ft
Est. Value
About This Home
This home is located at 3014 Denise Dr, Benton, AR 72015 and is currently estimated at $283,933, approximately $151 per square foot. 3014 Denise Dr is a home located in Saline County with nearby schools including Hurricane Creek Elementary School, Bryant Middle School, and Bethel Middle School.
Ownership History
Date
Name
Owned For
Owner Type
Purchase Details
Closed on
May 4, 2017
Sold by
Armstrong Trevor Michael and Armstrong Amy L
Bought by
Murphy Christine A
Current Estimated Value
Home Financials for this Owner
Home Financials are based on the most recent Mortgage that was taken out on this home.
Original Mortgage
$179,193
Outstanding Balance
$149,549
Interest Rate
4.23%
Mortgage Type
FHA
Estimated Equity
$134,384
Purchase Details
Closed on
Oct 30, 2009
Sold by
Chris Young Co Llc
Bought by
Armstrong Trevor Michael and Armstrong Amy L
Home Financials for this Owner
Home Financials are based on the most recent Mortgage that was taken out on this home.
Original Mortgage
$186,265
Interest Rate
5.05%
Mortgage Type
VA
Purchase Details
Closed on
Apr 29, 2009
Sold by
Briarstone Llc
Bought by
Chris Young Company Llc
Home Financials for this Owner
Home Financials are based on the most recent Mortgage that was taken out on this home.
Original Mortgage
$125,000
Interest Rate
4.77%
Mortgage Type
Credit Line Revolving
Create a Home Valuation Report for This Property
The Home Valuation Report is an in-depth analysis detailing your home's value as well as a comparison with similar homes in the area
Home Values in the Area
Average Home Value in this Area
Purchase History
| Date | Buyer | Sale Price | Title Company |
|---|---|---|---|
| Murphy Christine A | $182,500 | None Available | |
| Armstrong Trevor Michael | $182,000 | -- | |
| Chris Young Company Llc | $29,000 | -- |
Source: Public Records
Mortgage History
| Date | Status | Borrower | Loan Amount |
|---|---|---|---|
| Open | Murphy Christine A | $179,193 | |
| Previous Owner | Armstrong Trevor Michael | $186,265 | |
| Previous Owner | Chris Young Company Llc | $125,000 |
Source: Public Records
Tax History Compared to Growth
Tax History
| Year | Tax Paid | Tax Assessment Tax Assessment Total Assessment is a certain percentage of the fair market value that is determined by local assessors to be the total taxable value of land and additions on the property. | Land | Improvement |
|---|---|---|---|---|
| 2025 | $2,465 | $45,560 | $8,060 | $37,500 |
| 2024 | $2,342 | $45,560 | $8,060 | $37,500 |
| 2023 | $2,712 | $45,560 | $8,060 | $37,500 |
| 2022 | $2,517 | $45,560 | $8,060 | $37,500 |
| 2021 | $2,328 | $36,150 | $6,200 | $29,950 |
| 2020 | $2,328 | $36,150 | $6,200 | $29,950 |
| 2019 | $2,328 | $36,150 | $6,200 | $29,950 |
| 2018 | $2,324 | $36,150 | $6,200 | $29,950 |
| 2017 | $2,324 | $36,150 | $6,200 | $29,950 |
| 2016 | $1,806 | $35,140 | $6,000 | $29,140 |
| 2015 | $1,807 | $35,140 | $6,000 | $29,140 |
| 2014 | $1,821 | $35,140 | $6,000 | $29,140 |
Source: Public Records
Map
Nearby Homes
- 3323 Stonewall Dr
- 2905 Janet
- 2928 Palamino Dr
- 2518 Millbrook Dr
- 2501 Janet
- 3028 Sue St
- 3027 Sue St
- 12 Carwin
- 4004 Evergreen Dr
- 2521 Northshore Dr
- 3002 Sue St
- 4023 Mockingbird Cove
- 2523 Delaware Crossing
- 4102 Northshore Dr
- 2619 Valley Forge Dr
- 2509 Brookwood
- 2421 Kenneth Dr
- 3712 Hazelwood Dr
- 15.31 acres Interstate 30
- 18924 Interstate 30 N
- 3018 Denise Dr
- 3003 Millbrook Dr
- 3003 Denise Dr
- 3007 Denise Dr
- 3005 Millbrook Dr
- 3010 Denise Dr
- 3023 Denise Dr
- 3015 Denise Dr
- 3006 Denise Dr
- 3011 Denise Dr
- 2916 Millbrook Dr
- 3002 Millbrook Dr
- 0 Millbrook Dr
- 3007 Millbrook Dr
- 2914 Millbrook Dr
- 3002 Denise Dr
- 3004 Millbrook Dr
- 2994 Oakbrook
- 3104 Hamilton Cove