Estimated Value: $65,000 - $80,000
2
Beds
1
Bath
672
Sq Ft
$112/Sq Ft
Est. Value
About This Home
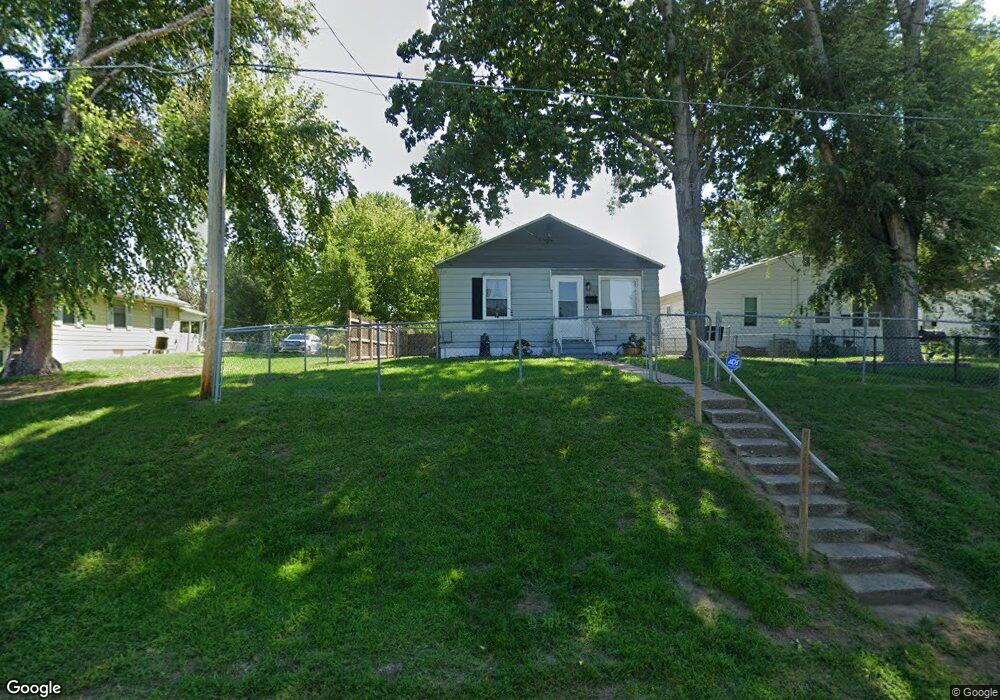
This home is located at 3015 8th St, Rock Island, IL 61201 and is currently estimated at $75,399, approximately $112 per square foot. 3015 8th St is a home located in Rock Island County with nearby schools including Frances Willard Elementary School, Edison Jr High School, and Rock Island High School.
Ownership History
Date
Name
Owned For
Owner Type
Purchase Details
Closed on
Jul 3, 2024
Sold by
Crc Of Iowa Inc
Bought by
Brown Ricky and Brown Melissa
Current Estimated Value
Home Financials for this Owner
Home Financials are based on the most recent Mortgage that was taken out on this home.
Original Mortgage
$72,420
Outstanding Balance
$71,557
Interest Rate
7%
Mortgage Type
FHA
Estimated Equity
$3,842
Purchase Details
Closed on
Jul 13, 2022
Sold by
Bryner Dawn M
Bought by
Crc Of Iowa Inc
Purchase Details
Closed on
Feb 1, 2007
Create a Home Valuation Report for This Property
The Home Valuation Report is an in-depth analysis detailing your home's value as well as a comparison with similar homes in the area
Home Values in the Area
Average Home Value in this Area
Purchase History
| Date | Buyer | Sale Price | Title Company |
|---|---|---|---|
| Brown Ricky | $68,900 | Greater Illinois Title | |
| Crc Of Iowa Inc | -- | Crc Of Iowa Inc | |
| -- | $21,900 | -- |
Source: Public Records
Mortgage History
| Date | Status | Borrower | Loan Amount |
|---|---|---|---|
| Open | Brown Ricky | $72,420 |
Source: Public Records
Tax History Compared to Growth
Tax History
| Year | Tax Paid | Tax Assessment Tax Assessment Total Assessment is a certain percentage of the fair market value that is determined by local assessors to be the total taxable value of land and additions on the property. | Land | Improvement |
|---|---|---|---|---|
| 2024 | $633 | $17,292 | $3,979 | $13,313 |
| 2023 | $633 | $15,820 | $3,640 | $12,180 |
| 2022 | $904 | $14,841 | $3,415 | $11,426 |
| 2021 | $854 | $14,094 | $3,243 | $10,851 |
| 2020 | $819 | $13,710 | $3,155 | $10,555 |
| 2019 | $751 | $13,574 | $3,124 | $10,450 |
| 2018 | $751 | $13,217 | $3,042 | $10,175 |
| 2017 | $724 | $12,778 | $2,941 | $9,837 |
| 2016 | $694 | $12,778 | $2,941 | $9,837 |
| 2015 | $1,296 | $12,778 | $2,941 | $9,837 |
| 2014 | $307 | $12,622 | $2,905 | $9,717 |
| 2013 | $307 | $12,622 | $2,905 | $9,717 |
Source: Public Records
Map
Nearby Homes