A
Seller's Agent in 2025
Alice Jolley
Re/Max Of Albany
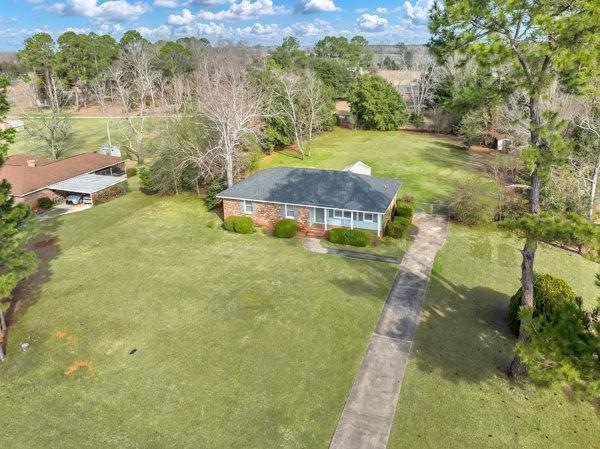
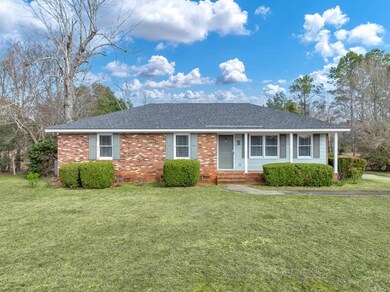

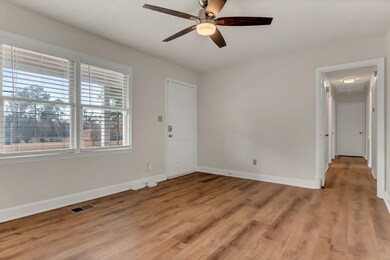
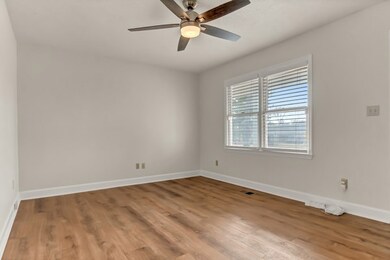


Step into this beautifully maintained home in Winterwood Subdivision, offering 3 bedrooms, 2 bathrooms, and nearly an acre of fully fenced land. With fresh paint and gorgeous new flooring throughout, this home exudes charm. The kitchen shines with sleek black granite countertops, and plantation blinds add a touch of class. The roof was replaced in 2017, and the septic lines were updated in 2020. Plus, enjoy a spacious backyard that's perfect for outdoor activities. This home has been well cared for and is ready for its new owner! Set a time to see this home today. Building does not stay.
Last Agent to Sell the Property
Alice Jolley
Re/Max Of Albany Brokerage Phone: 2294341600 Listed on: 02/11/2025

Last Buyer's Agent
Joshua Fralish
Hrp Realty, LLC
| Date | Type | Sale Price | Title Company |
|---|---|---|---|
| Warranty Deed | $171,500 | -- | |
| Deed | -- | -- | |
| Warranty Deed | -- | -- | |
| Deed | -- | -- |
| Date | Status | Loan Amount | Loan Type |
|---|---|---|---|
| Open | $171,500 | VA | |
| Previous Owner | $84,000 | New Conventional |
| Date | Event | Price | List to Sale | Price per Sq Ft |
|---|---|---|---|---|
| 04/27/2025 04/27/25 | Off Market | $165,900 | -- | -- |
| 04/25/2025 04/25/25 | Sold | $171,500 | +3.4% | $130 / Sq Ft |
| 03/21/2025 03/21/25 | Pending | -- | -- | -- |
| 03/10/2025 03/10/25 | Price Changed | $165,900 | -3.8% | $126 / Sq Ft |
| 02/11/2025 02/11/25 | For Sale | $172,500 | -- | $131 / Sq Ft |
| Year | Tax Paid | Tax Assessment Tax Assessment Total Assessment is a certain percentage of the fair market value that is determined by local assessors to be the total taxable value of land and additions on the property. | Land | Improvement |
|---|---|---|---|---|
| 2024 | $1,477 | $30,960 | $7,200 | $23,760 |
| 2023 | $1,442 | $30,960 | $7,200 | $23,760 |
| 2022 | $1,448 | $30,960 | $7,200 | $23,760 |
| 2021 | $1,342 | $30,960 | $7,200 | $23,760 |
| 2020 | $1,345 | $30,960 | $7,200 | $23,760 |
| 2019 | $1,351 | $30,960 | $7,200 | $23,760 |
| 2018 | $1,356 | $30,960 | $7,200 | $23,760 |
| 2017 | $1,263 | $30,960 | $7,200 | $23,760 |
| 2016 | $1,264 | $30,960 | $7,200 | $23,760 |
| 2015 | $1,268 | $30,960 | $7,200 | $23,760 |
| 2014 | $1,252 | $30,960 | $7,200 | $23,760 |
A
Seller's Agent in 2025
Alice Jolley
Re/Max Of Albany
J
Buyer's Agent in 2025
Joshua Fralish
Hrp Realty, LLC
Source: Albany Board of REALTORS®
MLS Number: 164362
APN: 00364-00010-020