Estimated Value: $195,000 - $233,000
--
Bed
2
Baths
1,486
Sq Ft
$143/Sq Ft
Est. Value
About This Home
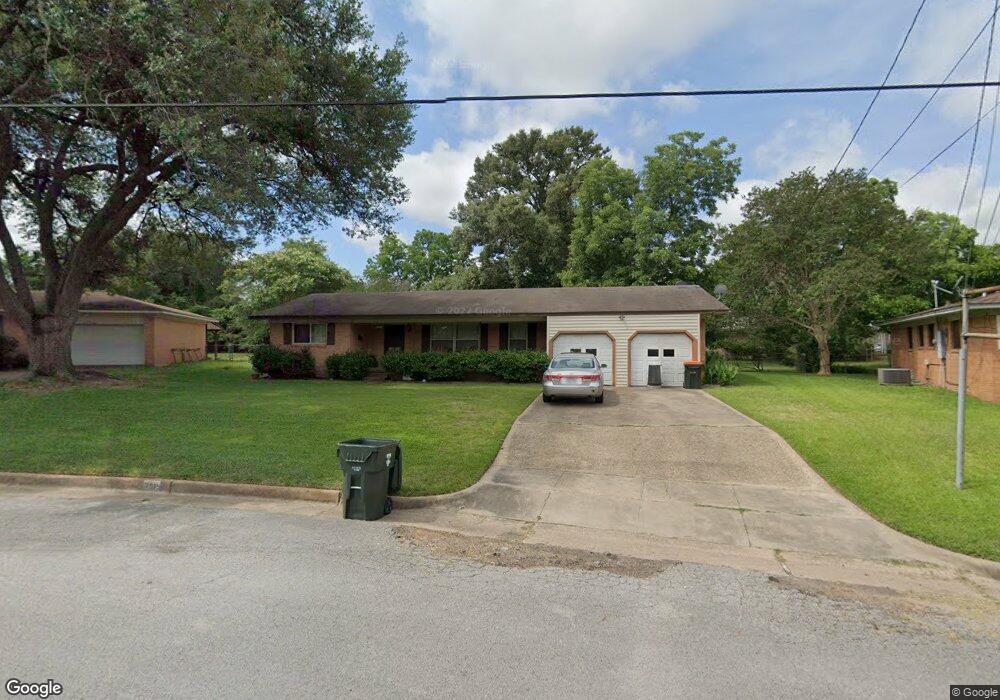
This home is located at 3015 Brentwood Dr, Tyler, TX 75701 and is currently estimated at $212,411, approximately $142 per square foot. 3015 Brentwood Dr is a home located in Smith County with nearby schools including Clarkston Elementary School, Hubbard Middle School, and Tyler Legacy High School.
Create a Home Valuation Report for This Property
The Home Valuation Report is an in-depth analysis detailing your home's value as well as a comparison with similar homes in the area
Home Values in the Area
Average Home Value in this Area
Tax History Compared to Growth
Tax History
| Year | Tax Paid | Tax Assessment Tax Assessment Total Assessment is a certain percentage of the fair market value that is determined by local assessors to be the total taxable value of land and additions on the property. | Land | Improvement |
|---|---|---|---|---|
| 2025 | $1,432 | $230,664 | $54,383 | $176,281 |
| 2024 | $1,432 | $140,601 | $29,400 | $178,481 |
| 2023 | $2,228 | $168,953 | $29,400 | $139,553 |
| 2022 | $2,277 | $145,620 | $24,192 | $121,428 |
| 2021 | $2,216 | $105,635 | $24,192 | $81,443 |
| 2020 | $2,162 | $101,048 | $24,192 | $76,856 |
| 2019 | $2,058 | $97,536 | $24,192 | $73,344 |
| 2018 | $1,861 | $85,553 | $16,800 | $68,753 |
| 2017 | $1,951 | $91,380 | $16,800 | $74,580 |
| 2016 | $1,871 | $87,628 | $16,800 | $70,828 |
| 2015 | $1,523 | $84,665 | $16,800 | $67,865 |
| 2014 | $1,523 | $82,230 | $16,800 | $65,430 |
Source: Public Records
Map
Nearby Homes
- 3014 Brentwood Dr
- 3027 Brentwood Dr
- 2936 Rollingwood Dr
- 3020 Meadowlark Ln
- 2110 Crestwood Dr
- 2103 Crestwood Dr
- 2019 Woodhaven Dr
- 2909 Meadowlark Ln
- 3205 Timberlane Dr
- 2523 Shenandoah Dr
- 2033 Old Omen Rd
- 1920 McDonald Rd
- 2713 Brentwood Dr
- 1835 Melba Dr
- 2713 Tanglewood Dr
- 3108 Williamsburg Cir
- 2216 Gish Ln
- 3401 Omega Dr
- 2801 Valley View St
- 2931 Meadow Brook Trail
- 3019 Brentwood Dr
- 3011 Brentwood Dr
- 3023 Mistletoe Cir
- 3016 Rollingwood Dr
- 3023 Brentwood Dr
- 3012 Rollingwood Dr
- 3028 Rollingwood Dr
- 3019 3019 Mistletoe Cir
- 3028 3028 Rollingwood
- 3006 Rollingwood Dr
- 3019 Mistletoe Cir
- 3005 Brentwood Dr
- 3030 Rollingwood Dr
- 3006 3006 Rollingwood
- 3030 3030 Rollingwood Dr
- 3026 3026 Brentwood Dr
- 3026 Brentwood Dr
- 3015 Mistletoe Cir
- 3004 Brentwood Dr
- 2123 Briarwood Dr