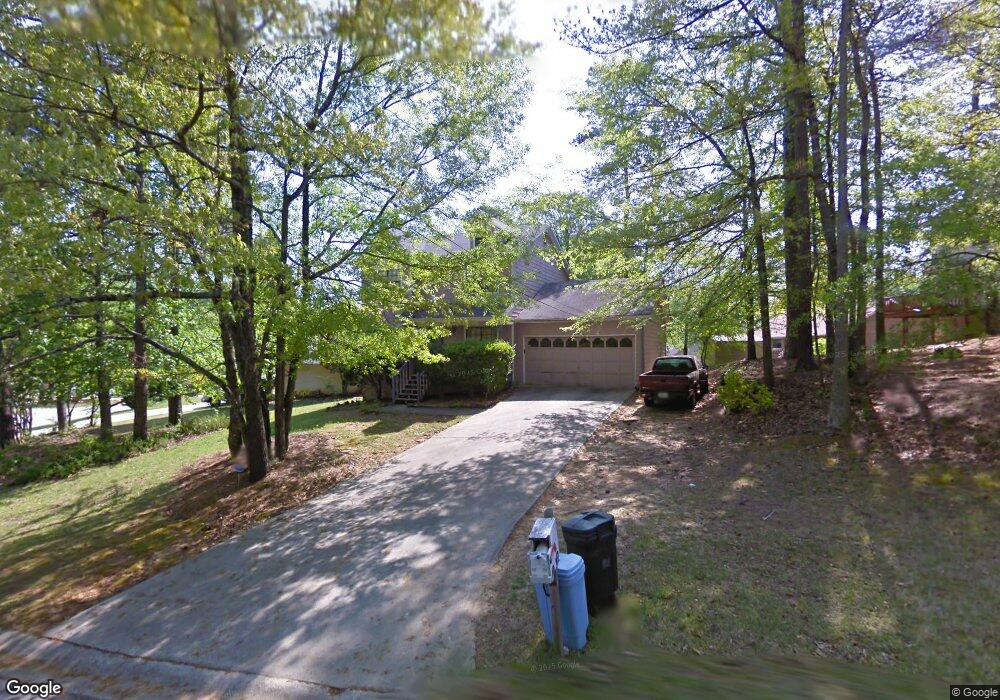
3015 Carriage Trail Jonesboro, GA 30236
Estimated Value: $224,000 - $268,000
3
Beds
3
Baths
1,452
Sq Ft
$172/Sq Ft
Est. Value
About This Home
This home is located at 3015 Carriage Trail, Jonesboro, GA 30236 and is currently estimated at $249,506, approximately $171 per square foot. 3015 Carriage Trail is a home located in Clayton County with nearby schools including Mt. Zion Primary School, Mount Zion Elementary School, and Rex Mill Middle School.
Ownership History
Date
Name
Owned For
Owner Type
Purchase Details
Closed on
Mar 13, 2018
Sold by
Neron North America Inc
Bought by
Roberson Eddie R
Current Estimated Value
Home Financials for this Owner
Home Financials are based on the most recent Mortgage that was taken out on this home.
Original Mortgage
$128,627
Outstanding Balance
$110,534
Interest Rate
4.5%
Mortgage Type
FHA
Estimated Equity
$138,972
Purchase Details
Closed on
Apr 18, 2017
Bought by
Neron North America Inc
Purchase Details
Closed on
Oct 4, 2016
Bought by
Sec Of Housing & Urban
Purchase Details
Closed on
Jul 3, 2003
Sold by
Siskind Raemone L
Bought by
Jones Rickey
Home Financials for this Owner
Home Financials are based on the most recent Mortgage that was taken out on this home.
Original Mortgage
$115,354
Interest Rate
5.16%
Mortgage Type
FHA
Create a Home Valuation Report for This Property
The Home Valuation Report is an in-depth analysis detailing your home's value as well as a comparison with similar homes in the area
Home Values in the Area
Average Home Value in this Area
Purchase History
| Date | Buyer | Sale Price | Title Company |
|---|---|---|---|
| Roberson Eddie R | $131,000 | -- | |
| Neron North America Inc | $70,533 | -- | |
| Sec Of Housing & Urban | $55,250 | -- | |
| Midfirst Bank | $55,250 | -- | |
| Jones Rickey | $117,200 | -- |
Source: Public Records
Mortgage History
| Date | Status | Borrower | Loan Amount |
|---|---|---|---|
| Open | Roberson Eddie R | $128,627 | |
| Previous Owner | Jones Rickey | $115,354 |
Source: Public Records
Tax History Compared to Growth
Tax History
| Year | Tax Paid | Tax Assessment Tax Assessment Total Assessment is a certain percentage of the fair market value that is determined by local assessors to be the total taxable value of land and additions on the property. | Land | Improvement |
|---|---|---|---|---|
| 2024 | $3,755 | $96,240 | $8,000 | $88,240 |
| 2023 | $3,189 | $88,320 | $8,000 | $80,320 |
| 2022 | $3,020 | $76,960 | $8,000 | $68,960 |
| 2021 | $2,221 | $56,240 | $8,000 | $48,240 |
| 2020 | $1,972 | $49,312 | $8,000 | $41,312 |
| 2019 | $1,881 | $46,337 | $6,400 | $39,937 |
| 2018 | $1,145 | $28,213 | $6,400 | $21,813 |
| 2017 | $1,190 | $29,247 | $6,400 | $22,847 |
| 2016 | $1,082 | $26,586 | $6,400 | $20,186 |
| 2015 | $629 | $0 | $0 | $0 |
| 2014 | $553 | $23,891 | $7,200 | $16,691 |
Source: Public Records
Map
Nearby Homes
- 3087 Drexel Ln
- 2959 Drexel Ln
- 7074 Babbling Brook Dr
- 7101 Hazelwood Dr Unit 8
- 2973 Botany Dr
- 6968 Fielder Rd
- 7161 Laurel Creek Dr
- 3140 Glen Hollow Dr
- 3145 Deerfield Way
- 3189 Glen Hollow Dr
- 2968 Preston Dr
- 6921 Babbling Brook Dr
- 2877 Kensington Way
- 3193 Medina Dr
- 7274 Mountain Laurel Way
- 3168 Rock Creek Dr
- 3085 Ashbury Ln Unit 8
- 3353 Medina Dr
- 6844 Silver Maple Dr
- 3027 Carriage Trail Unit 6
- 3028 Drexel Ln
- 3024 Drexel Ln
- 3032 Drexel Ln Unit 6
- 3039 Carriage Trail Unit 6
- 3040 Drexel Ln
- 3010 Carriage Trail
- 3014 Carriage Trail
- 3006 Carriage Trail
- 3026 Carriage Trace
- 3026 Carriage Trail Unit N/a
- 3026 Carriage Trail Unit .
- 3026 Carriage Trail
- 3020 Carriage Trail
- 3045 Carriage Trail
- 3048 Drexel Ln
- 3032 Carriage Trail
- 2997 Carriage Trail
- 3040 Carriage Trail
- 3033 Drexel Ln Unit 6