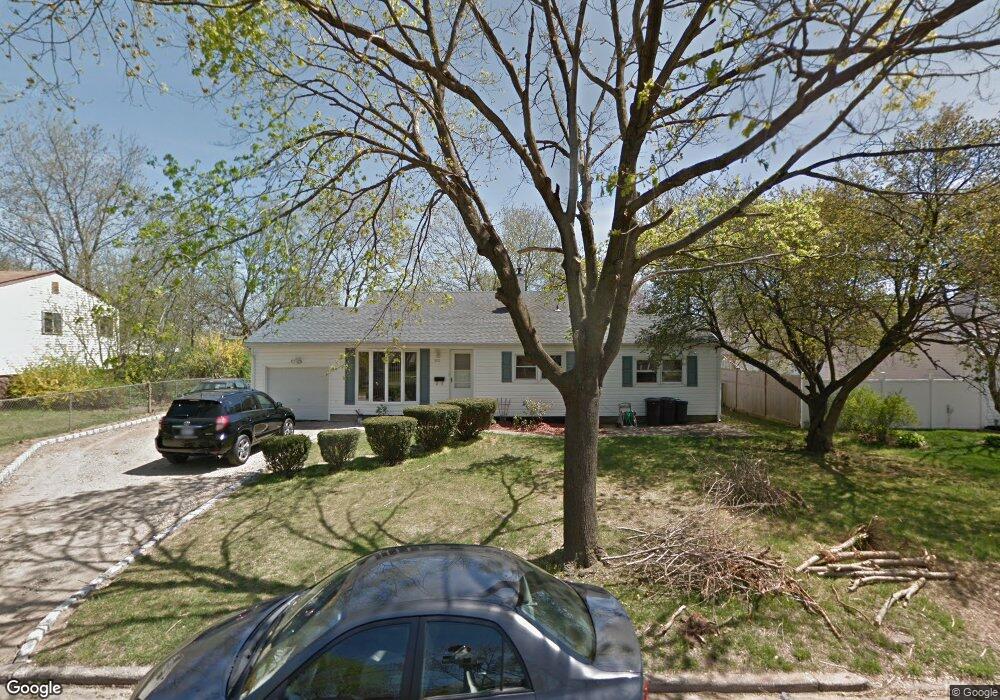
3015 Falcon Ave Medford, NY 11763
Estimated Value: $429,000 - $612,000
4
Beds
2
Baths
1,754
Sq Ft
$310/Sq Ft
Est. Value
About This Home
This home is located at 3015 Falcon Ave, Medford, NY 11763 and is currently estimated at $543,588, approximately $309 per square foot. 3015 Falcon Ave is a home located in Suffolk County with nearby schools including Patchogue-Medford High School.
Ownership History
Date
Name
Owned For
Owner Type
Purchase Details
Closed on
Oct 19, 2023
Sold by
Vega Lisa and Steinert Rosa
Bought by
Sooknana Kishore
Current Estimated Value
Home Financials for this Owner
Home Financials are based on the most recent Mortgage that was taken out on this home.
Original Mortgage
$351,037
Interest Rate
7.76%
Mortgage Type
FHA
Purchase Details
Closed on
Nov 3, 2008
Sold by
Latorre Susan A
Bought by
Sooknana Kishore
Home Financials for this Owner
Home Financials are based on the most recent Mortgage that was taken out on this home.
Original Mortgage
$237,864
Interest Rate
6.13%
Mortgage Type
Purchase Money Mortgage
Purchase Details
Closed on
Aug 1, 2001
Sold by
Latorre Michael P
Bought by
Latorre Michael P and Latorre Susan A
Create a Home Valuation Report for This Property
The Home Valuation Report is an in-depth analysis detailing your home's value as well as a comparison with similar homes in the area
Home Values in the Area
Average Home Value in this Area
Purchase History
| Date | Buyer | Sale Price | Title Company |
|---|---|---|---|
| Sooknana Kishore | $85,000 | None Available | |
| Sooknana Kishore | $85,000 | None Available | |
| Sooknana Kishore | $241,044 | Peter Dunn | |
| Sooknana Kishore | $241,044 | Peter Dunn | |
| Latorre Michael P | -- | Commonwealth Land Title Ins | |
| Latorre Michael P | -- | Commonwealth Land Title Ins |
Source: Public Records
Mortgage History
| Date | Status | Borrower | Loan Amount |
|---|---|---|---|
| Previous Owner | Sooknana Kishore | $351,037 | |
| Previous Owner | Sooknana Kishore | $237,864 |
Source: Public Records
Tax History Compared to Growth
Tax History
| Year | Tax Paid | Tax Assessment Tax Assessment Total Assessment is a certain percentage of the fair market value that is determined by local assessors to be the total taxable value of land and additions on the property. | Land | Improvement |
|---|---|---|---|---|
| 2024 | $9,448 | $2,400 | $160 | $2,240 |
| 2023 | $9,448 | $2,400 | $160 | $2,240 |
| 2022 | $8,220 | $2,400 | $160 | $2,240 |
| 2021 | $8,220 | $2,400 | $160 | $2,240 |
| 2020 | $8,511 | $2,400 | $160 | $2,240 |
| 2019 | $8,511 | $0 | $0 | $0 |
| 2018 | $7,944 | $2,400 | $160 | $2,240 |
| 2017 | $7,944 | $2,400 | $160 | $2,240 |
| 2016 | $7,787 | $2,400 | $160 | $2,240 |
| 2015 | -- | $2,400 | $160 | $2,240 |
| 2014 | -- | $2,400 | $160 | $2,240 |
Source: Public Records
Map
Nearby Homes
- 3019 Sipp Ave
- 2401 Race Ave
- 0 Cedar Ln Unit ONE3556748
- 2909 Falcon Ave
- 3110 Kane Ave
- 1902 Race Ave
- 2405 Fire Ave
- 3106 Devon Ave
- 3115 Heather Ave
- 3004 New London Ave
- 2812 Sipp Ave
- 3115 Chestnut Ave
- 1600 Fire Ave
- 2905 Beechnut Ave
- 1401 Race Ave
- 2712 Falcon Ave
- 1301 Race Ave
- 1300 Race Ave
- 49 Country Rd
- 37 Lot 2 Locust Ave S
- 3011 Falcon Ave
- 3012 Sipp Ave
- 3010 Sipp Ave
- 3014 Sipp Ave
- 3019 Falcon Ave
- 3009 Falcon Ave
- 3014 Falcon Ave
- 3008 Sipp Ave
- 3016 Sipp Ave
- Lot 14 &15 Shirley Ln
- 3016 Falcon Ave
- 3008 Falcon Ave
- 2300 Wave Ave
- 3007 Falcon Ave
- 3015 Connecticut Ave
- 2302 Wave Ave
- 3006 Sipp Ave
- 3017 Connecticut Ave
- 3011 Connecticut Ave
- 3015 Sipp Ave