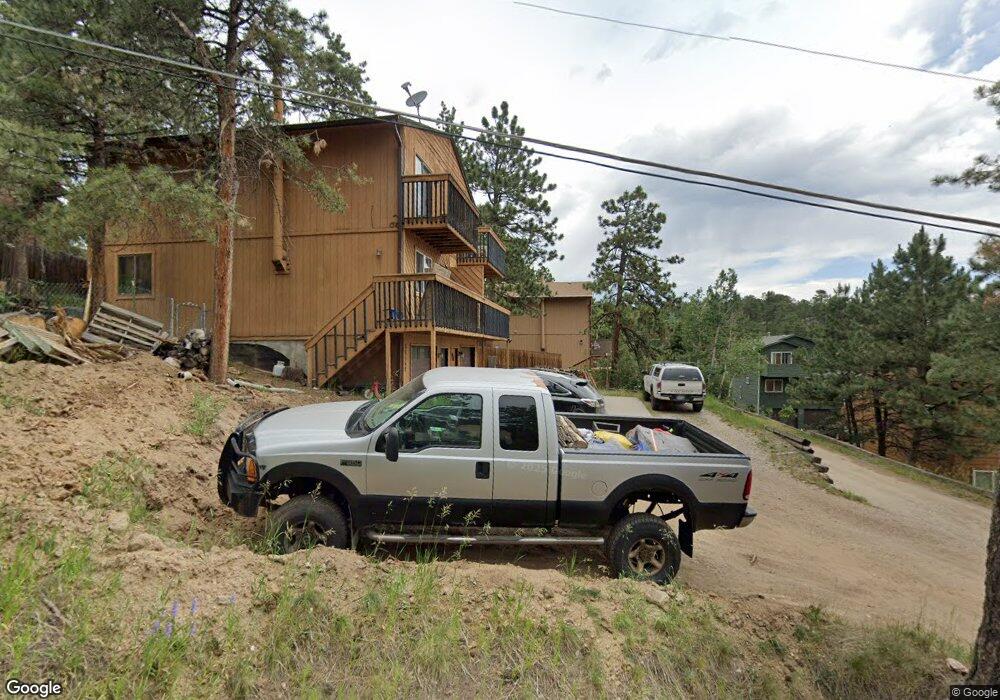
30155 Aspen Ln Evergreen, CO 80439
Estimated Value: $443,000 - $512,000
3
Beds
2
Baths
1,464
Sq Ft
$328/Sq Ft
Est. Value
About This Home
This home is located at 30155 Aspen Ln, Evergreen, CO 80439 and is currently estimated at $479,811, approximately $327 per square foot. 30155 Aspen Ln is a home located in Jefferson County with nearby schools including Bergen Meadow Primary School, Bergen Valley Intermediate School, and Evergreen Middle School.
Ownership History
Date
Name
Owned For
Owner Type
Purchase Details
Closed on
Jun 16, 2011
Sold by
Us Bank National Association
Bought by
Kulbacki Kevin L
Current Estimated Value
Purchase Details
Closed on
Feb 17, 2011
Sold by
Us Bank National Association
Bought by
Kulbacki Kevin L
Home Financials for this Owner
Home Financials are based on the most recent Mortgage that was taken out on this home.
Original Mortgage
$64,000
Interest Rate
4.78%
Mortgage Type
New Conventional
Purchase Details
Closed on
Aug 6, 2010
Sold by
Corkman Erik M
Bought by
Us Bank National Association
Purchase Details
Closed on
Jun 23, 2000
Sold by
Benkendorf George F Benkendorf Sandra J
Bought by
Corkran Erik M
Home Financials for this Owner
Home Financials are based on the most recent Mortgage that was taken out on this home.
Original Mortgage
$134,102
Interest Rate
8.5%
Mortgage Type
FHA
Create a Home Valuation Report for This Property
The Home Valuation Report is an in-depth analysis detailing your home's value as well as a comparison with similar homes in the area
Home Values in the Area
Average Home Value in this Area
Purchase History
| Date | Buyer | Sale Price | Title Company |
|---|---|---|---|
| Kulbacki Kevin L | $80,000 | Assured Title | |
| Kulbacki Kevin L | $80,000 | Assured Title | |
| Us Bank National Association | -- | None Available | |
| Corkran Erik M | $135,000 | -- |
Source: Public Records
Mortgage History
| Date | Status | Borrower | Loan Amount |
|---|---|---|---|
| Previous Owner | Kulbacki Kevin L | $64,000 | |
| Previous Owner | Corkran Erik M | $134,102 |
Source: Public Records
Tax History Compared to Growth
Tax History
| Year | Tax Paid | Tax Assessment Tax Assessment Total Assessment is a certain percentage of the fair market value that is determined by local assessors to be the total taxable value of land and additions on the property. | Land | Improvement |
|---|---|---|---|---|
| 2024 | $2,401 | $26,184 | $6,449 | $19,735 |
| 2023 | $2,401 | $26,184 | $6,449 | $19,735 |
| 2022 | $2,037 | $21,564 | $4,917 | $16,647 |
| 2021 | $2,058 | $22,184 | $5,058 | $17,126 |
| 2020 | $1,768 | $18,906 | $2,221 | $16,685 |
| 2019 | $1,743 | $18,906 | $2,221 | $16,685 |
| 2018 | $1,585 | $16,630 | $2,254 | $14,376 |
| 2017 | $1,443 | $16,630 | $2,254 | $14,376 |
| 2016 | $1,294 | $13,929 | $4,154 | $9,775 |
| 2015 | $1,116 | $13,929 | $4,154 | $9,775 |
| 2014 | $1,116 | $11,664 | $3,744 | $7,920 |
Source: Public Records
Map
Nearby Homes
- 30273 Conifer Rd
- 3046 Sun Creek Ridge
- 30172 Hilltop Dr
- 0000 Sun Creek Dr
- 2977 Sun Creek Ridge
- 3055 Yucca Dr
- 30584 Sun Creek Dr Unit 12W
- 30357 Appaloosa Dr
- 32 Sulky Ln
- 32430 Inverness Dr
- 3260 Bit Rd
- 2667 Keystone Dr
- 2873 Cortina Ln
- 2851 Interlocken Dr
- 3251 Interlocken Dr
- 29491 Camelback Ln
- 29210 Northstar Ln
- 2828 Keystone Dr
- 30593 Golf Club Point
- 2397 Hearth Dr
- 30157 Aspen Ln
- 30153 Aspen Ln
- 30099 Aspen Ln
- 30159 Aspen Ln
- 30079 Aspen Ln
- 30179 Aspen Ln
- 30169 Aspen Ln
- 30059 Aspen Ln
- 30128 Aspen Ln
- 30201 Aspen Ln
- 30133 Spruce Rd
- 2943 Sugarpine Trail
- 30209 Aspen Ln
- 30211 Aspen Ln
- 30213 Aspen Ln
- 30203 Aspen Ln
- 30205 Aspen Ln
- 30207 Aspen Ln
- 2953 Sugarpine Trail
- 30215 Aspen Ln