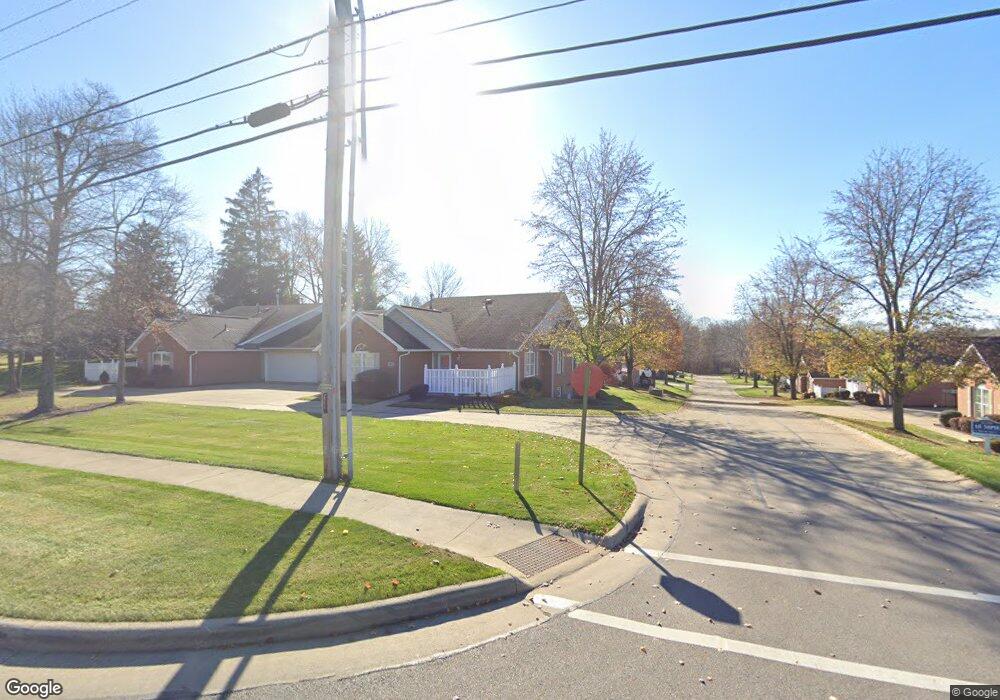
3016 Bayberry Cove Unit 3016 Wooster, OH 44691
Estimated Value: $229,000 - $254,000
3
Beds
3
Baths
1,087
Sq Ft
$222/Sq Ft
Est. Value
About This Home
This home is located at 3016 Bayberry Cove Unit 3016, Wooster, OH 44691 and is currently estimated at $240,893, approximately $221 per square foot. 3016 Bayberry Cove Unit 3016 is a home located in Wayne County with nearby schools including Melrose Elementary School, Edgewood Middle School, and Wooster High School.
Ownership History
Date
Name
Owned For
Owner Type
Purchase Details
Closed on
Jul 30, 2014
Sold by
Mcdaid William F and Mcdaid Lynee D
Bought by
Mcdaid Carol A and Mcdaid Richard J
Current Estimated Value
Purchase Details
Closed on
Jul 18, 2014
Sold by
Mcdaid James M
Bought by
Mcdaid Carol A
Purchase Details
Closed on
Jun 28, 2008
Sold by
Lathrop Vicky Jo
Bought by
Mcdaid Richard J and Mcdaid Eileen A
Purchase Details
Closed on
Dec 1, 2003
Sold by
Belcher B Laura
Bought by
Dettis Charles E
Purchase Details
Closed on
Jun 22, 2001
Sold by
Weaver Custom Homes
Bought by
Belcher B Laura
Home Financials for this Owner
Home Financials are based on the most recent Mortgage that was taken out on this home.
Original Mortgage
$90,000
Interest Rate
7.11%
Mortgage Type
New Conventional
Create a Home Valuation Report for This Property
The Home Valuation Report is an in-depth analysis detailing your home's value as well as a comparison with similar homes in the area
Home Values in the Area
Average Home Value in this Area
Purchase History
| Date | Buyer | Sale Price | Title Company |
|---|---|---|---|
| Mcdaid Carol A | $35,000 | Attorney | |
| Mcdaid Carol A | -- | None Available | |
| Mcdaid Carol A | $35,000 | Attorney | |
| Mcdaid Richard J | $148,000 | Wayne County Title | |
| Dettis Charles E | $136,500 | Wayne County Title Agency | |
| Belcher B Laura | $131,993 | -- |
Source: Public Records
Mortgage History
| Date | Status | Borrower | Loan Amount |
|---|---|---|---|
| Previous Owner | Belcher B Laura | $90,000 |
Source: Public Records
Tax History Compared to Growth
Tax History
| Year | Tax Paid | Tax Assessment Tax Assessment Total Assessment is a certain percentage of the fair market value that is determined by local assessors to be the total taxable value of land and additions on the property. | Land | Improvement |
|---|---|---|---|---|
| 2024 | $2,926 | $70,560 | $8,640 | $61,920 |
| 2023 | $2,926 | $70,560 | $8,640 | $61,920 |
| 2022 | $2,608 | $50,040 | $6,130 | $43,910 |
| 2021 | $2,775 | $50,040 | $6,130 | $43,910 |
| 2020 | $2,636 | $50,040 | $6,130 | $43,910 |
| 2019 | $2,294 | $41,600 | $5,020 | $36,580 |
| 2018 | $2,300 | $41,600 | $5,020 | $36,580 |
| 2017 | $2,287 | $41,600 | $5,020 | $36,580 |
| 2016 | $2,386 | $40,010 | $4,830 | $35,180 |
| 2015 | $2,344 | $40,010 | $4,830 | $35,180 |
| 2014 | $2,409 | $40,010 | $4,830 | $35,180 |
| 2013 | $2,019 | $42,560 | $5,400 | $37,160 |
Source: Public Records
Map
Nearby Homes
- 1315 E Milltown Rd
- 3271 Bayberry Cove
- 1495 Summerlin Dr
- 3569 Cleveland Rd
- 1425 Hickory Ln
- 2782 Tanglewood Dr
- 1469 Stratford Way
- 0 Winkler Dr
- 2667 Estate Dr
- 751 Greenwood Blvd
- V/L 6838 Forest Creek Dr
- 594 Forest Creek Dr
- 4157 Fieldridge Ct
- 458 Mather Hill Dr
- 3393 Friendsville Rd
- 471 Mather Hill Dr
- 3377 Friendsville Rd
- 539 Forest Creek Dr Unit 6842
- 437 Mather Hill Dr
- 220 Kinney St
- 3012 Bayberry Cove
- 3018 Bayberry Cove
- 3014 Bayberry Cove
- 3054 Bayberry Cove Unit 3054
- 3011 Bayberry Cove
- 3013 Bayberry Cove Unit 3013
- 3056 Bayberry Cove Unit 3056
- 3058 Bayberry Cove Unit 3058
- 3383 Bayberry Cove Unit 3383
- 3385 Bayberry Cove
- 3053 Bayberry Cove
- 3057 Bayberry Cove
- 3055 Bayberry Cove
- 3072 Bayberry Cove
- 3074 Bayberry Cove
- 3076 Bayberry Cove Unit 3076
- 3073 Bayberry Cove
- 3086 Bayberry Cove Unit 3086
- 3082 Bayberry Cove
- 3078 Bayberry Cove