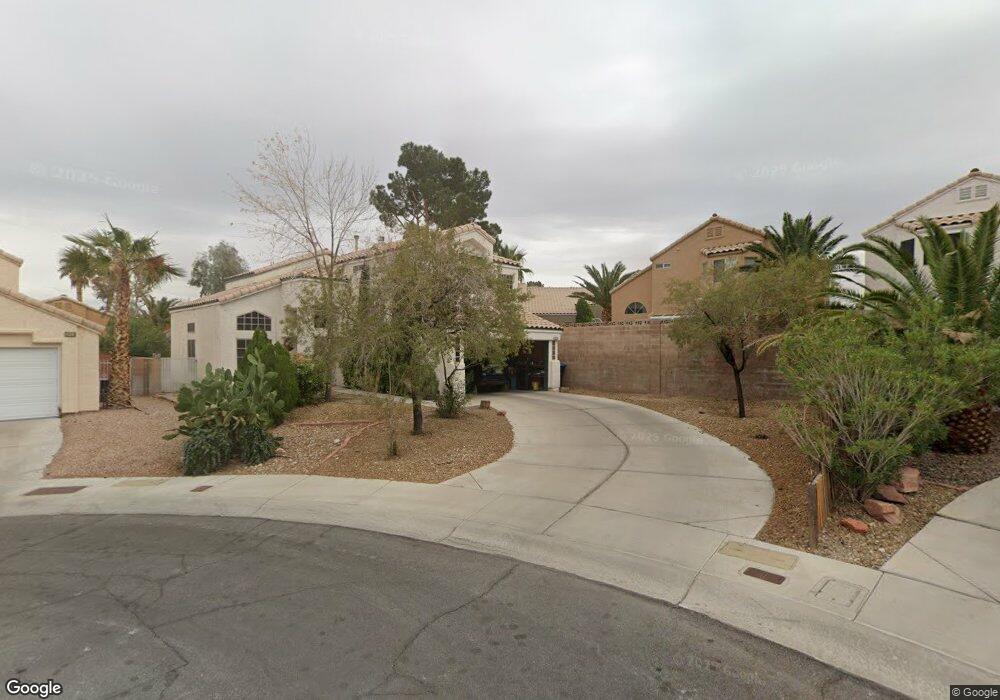
3016 Brigantine Way Las Vegas, NV 89128
Desert Shores NeighborhoodEstimated Value: $491,286 - $587,000
4
Beds
3
Baths
2,185
Sq Ft
$243/Sq Ft
Est. Value
About This Home
This home is located at 3016 Brigantine Way, Las Vegas, NV 89128 and is currently estimated at $531,322, approximately $243 per square foot. 3016 Brigantine Way is a home located in Clark County with nearby schools including Marc Kahre Elementary School, Dorothy Eisenberg Elementary School, and Ernest Becker Middle School.
Ownership History
Date
Name
Owned For
Owner Type
Purchase Details
Closed on
Dec 14, 1999
Sold by
Williams Clarence R and Williams Karen L
Bought by
Macri Alex R
Current Estimated Value
Home Financials for this Owner
Home Financials are based on the most recent Mortgage that was taken out on this home.
Original Mortgage
$100,000
Outstanding Balance
$28,969
Interest Rate
6.87%
Estimated Equity
$502,353
Purchase Details
Closed on
Jun 26, 1996
Sold by
Baird Christopher G and Baird Tina L
Bought by
Williams Clarence Robert and Williams Karen L
Home Financials for this Owner
Home Financials are based on the most recent Mortgage that was taken out on this home.
Original Mortgage
$126,800
Interest Rate
8.09%
Mortgage Type
Balloon
Purchase Details
Closed on
Jun 22, 1994
Sold by
Hess Derek S and Hess Barbara J
Bought by
Baird Christopher G and Baird Tina Louise
Home Financials for this Owner
Home Financials are based on the most recent Mortgage that was taken out on this home.
Original Mortgage
$137,750
Interest Rate
7.88%
Create a Home Valuation Report for This Property
The Home Valuation Report is an in-depth analysis detailing your home's value as well as a comparison with similar homes in the area
Home Values in the Area
Average Home Value in this Area
Purchase History
| Date | Buyer | Sale Price | Title Company |
|---|---|---|---|
| Macri Alex R | $157,000 | National Title Company | |
| Williams Clarence Robert | $158,500 | Nevada Title Company | |
| Baird Christopher G | $145,000 | Lawyers Title |
Source: Public Records
Mortgage History
| Date | Status | Borrower | Loan Amount |
|---|---|---|---|
| Open | Macri Alex R | $100,000 | |
| Previous Owner | Williams Clarence Robert | $126,800 | |
| Previous Owner | Baird Christopher G | $137,750 |
Source: Public Records
Tax History Compared to Growth
Tax History
| Year | Tax Paid | Tax Assessment Tax Assessment Total Assessment is a certain percentage of the fair market value that is determined by local assessors to be the total taxable value of land and additions on the property. | Land | Improvement |
|---|---|---|---|---|
| 2025 | $2,029 | $90,652 | $35,000 | $55,652 |
| 2024 | $1,971 | $90,652 | $35,000 | $55,652 |
| 2023 | $1,608 | $89,688 | $36,050 | $53,638 |
| 2022 | $1,913 | $76,672 | $27,300 | $49,372 |
| 2021 | $1,858 | $72,097 | $24,850 | $47,247 |
| 2020 | $1,801 | $70,260 | $23,100 | $47,160 |
| 2019 | $1,748 | $67,793 | $21,000 | $46,793 |
| 2018 | $1,697 | $62,552 | $17,500 | $45,052 |
| 2017 | $2,044 | $62,247 | $16,450 | $45,797 |
| 2016 | $1,608 | $61,347 | $15,050 | $46,297 |
| 2015 | $1,604 | $56,747 | $10,850 | $45,897 |
| 2014 | $1,557 | $50,927 | $8,750 | $42,177 |
Source: Public Records
Map
Nearby Homes
- 8329 Surfs Up Dr
- 2852 Soft Sun Cir
- 2849 Huber Heights Dr
- 3151 Soaring Gulls Dr Unit 2050
- 3151 Soaring Gulls Dr Unit 2055
- 3151 Soaring Gulls Dr Unit 2137
- 3151 Soaring Gulls Dr Unit 2197
- 3151 Soaring Gulls Dr Unit 1062
- 3151 Soaring Gulls Dr Unit 1100
- 3151 Soaring Gulls Dr Unit 2082
- 3151 Soaring Gulls Dr Unit 2160
- 3151 Soaring Gulls Dr Unit 2101
- 3151 Soaring Gulls Dr Unit 1188
- 3151 Soaring Gulls Dr Unit 2014
- 3151 Soaring Gulls Dr Unit 2121
- 3151 Soaring Gulls Dr Unit 1037
- 3151 Soaring Gulls Dr Unit 2034
- 3151 Soaring Gulls Dr Unit 1083
- 8500 Linderwood Dr
- 2824 Morning Ridge Dr
- 3020 Brigantine Way
- 8416 Oyster Dr
- 3024 Brigantine Way
- 8412 Oyster Dr
- 8420 Oyster Dr
- 3017 Marsh Ct
- 3017 Brigantine Way
- 3013 Marsh Ct
- 3021 Marsh Ct
- 3028 Brigantine Way
- 3021 Brigantine Way
- 3025 Marsh Ct
- 3009 Marsh Ct
- 3025 Brigantine Way
- 2920 Yacht Basin Rd
- 8428 Oyster Dr
- 8428 Oyster Dr Unit sfr
- 3032 Brigantine Way Unit 3
- 3029 Marsh Ct
- 3029 Brigantine Way