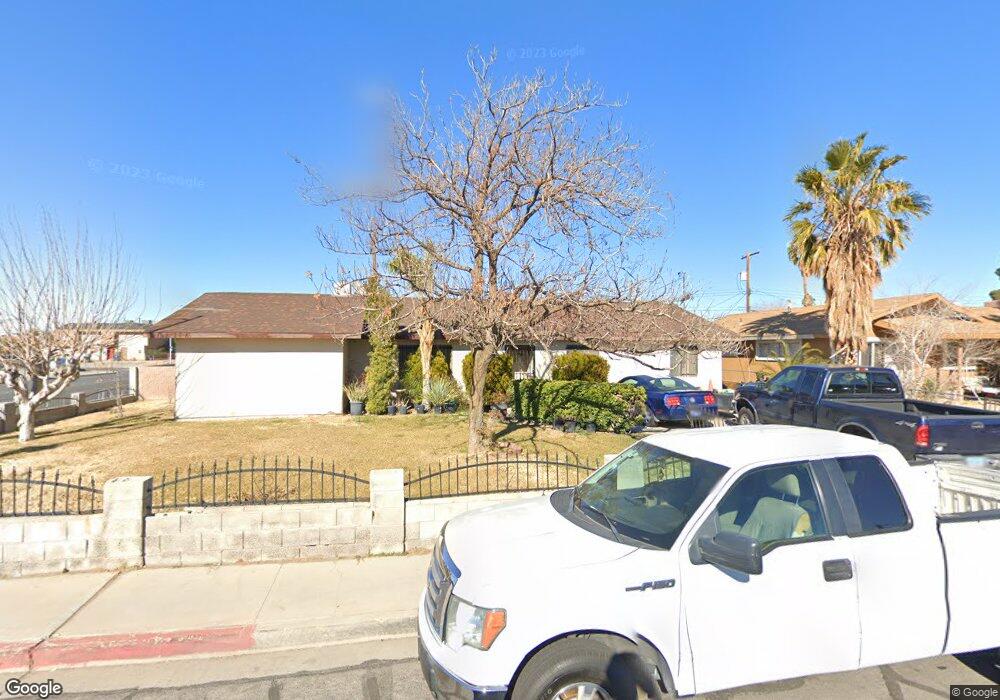
3016 Dillon Ave North Las Vegas, NV 89030
Downtown North Las Vegas NeighborhoodEstimated Value: $319,000 - $377,000
3
Beds
2
Baths
1,728
Sq Ft
$206/Sq Ft
Est. Value
About This Home
This home is located at 3016 Dillon Ave, North Las Vegas, NV 89030 and is currently estimated at $356,092, approximately $206 per square foot. 3016 Dillon Ave is a home located in Clark County with nearby schools including Jay W. Jeffers Elementary School, Von Tobel Middle School, and Desert Pines High School.
Ownership History
Date
Name
Owned For
Owner Type
Purchase Details
Closed on
Jul 31, 2025
Sold by
Yepez Pedro
Bought by
Yepez Elida
Current Estimated Value
Purchase Details
Closed on
May 18, 2005
Sold by
Yepez Elida
Bought by
Yepez Pedro
Home Financials for this Owner
Home Financials are based on the most recent Mortgage that was taken out on this home.
Original Mortgage
$115,300
Interest Rate
8.91%
Mortgage Type
Unknown
Purchase Details
Closed on
Jan 11, 2002
Sold by
Yepez Elida
Bought by
Yepez Pedro
Purchase Details
Closed on
Jan 10, 2002
Sold by
Arreola Diaz Froylan
Bought by
Yepez Pedro
Purchase Details
Closed on
Feb 1, 1995
Sold by
Aragon Jose E
Bought by
Yepez Pedro and Yepez Elida
Home Financials for this Owner
Home Financials are based on the most recent Mortgage that was taken out on this home.
Original Mortgage
$81,211
Interest Rate
8.9%
Create a Home Valuation Report for This Property
The Home Valuation Report is an in-depth analysis detailing your home's value as well as a comparison with similar homes in the area
Home Values in the Area
Average Home Value in this Area
Purchase History
| Date | Buyer | Sale Price | Title Company |
|---|---|---|---|
| Yepez Elida | -- | None Listed On Document | |
| Yepez Pedro | -- | First Amer Title Co Of Nv | |
| Yepez Pedro | $115,000 | Fidelity National Title | |
| Yepez Pedro | $115,000 | Fidelity National Title | |
| Yepez Pedro | $82,000 | Fidelity National Title |
Source: Public Records
Mortgage History
| Date | Status | Borrower | Loan Amount |
|---|---|---|---|
| Previous Owner | Yepez Pedro | $115,300 | |
| Previous Owner | Yepez Pedro | $81,211 |
Source: Public Records
Tax History Compared to Growth
Tax History
| Year | Tax Paid | Tax Assessment Tax Assessment Total Assessment is a certain percentage of the fair market value that is determined by local assessors to be the total taxable value of land and additions on the property. | Land | Improvement |
|---|---|---|---|---|
| 2025 | $1,295 | $54,454 | $24,500 | $29,954 |
| 2024 | $1,200 | $54,454 | $24,500 | $29,954 |
| 2023 | $1,200 | $54,024 | $24,500 | $29,524 |
| 2022 | $1,111 | $50,208 | $22,750 | $27,458 |
| 2021 | $1,029 | $45,717 | $19,250 | $26,467 |
| 2020 | $953 | $44,196 | $17,500 | $26,696 |
| 2019 | $893 | $39,251 | $12,600 | $26,651 |
| 2018 | $852 | $37,415 | $11,550 | $25,865 |
| 2017 | $1,241 | $37,000 | $10,500 | $26,500 |
| 2016 | $799 | $32,899 | $5,600 | $27,299 |
| 2015 | $796 | $32,887 | $5,600 | $27,287 |
| 2014 | $771 | $26,959 | $4,200 | $22,759 |
Source: Public Records
Map
Nearby Homes
- 3104 Dillon Ave
- 3104 Twining Ave
- 3215 Dillon Ave
- 3024 Orr Ave
- 3308 Tabor Ave
- 2252 Ellis St
- 3220 Orr Ave
- 0 Belmont St
- 3308 E Lake Mead Blvd
- 1912 Statz St
- 3204 Emmons Ave
- 3402 Lillis Cir
- 2315 N Mccarran St
- 2844 Hickey Ave
- 2801 Emmons Ave
- 2214 Daley St
- 2404 Bassler St
- 2321 Mccarran St
- 3101 Cypress Ave
- 1311 Flower Ave
- 3020 Dillon Ave
- 3017 Judson Ave
- 3024 Dillon Ave
- 3021 Judson Ave
- 3025 Judson Ave
- 3028 Dillon Ave
- 2151 Belmont St
- 2145 Belmont St
- 3021 Dillon Ave
- 2155 Belmont St
- 2137 Belmont St
- 3029 Judson Ave
- 3025 Dillon Ave
- 2159 Belmont St
- 3100 Dillon Ave
- 3029 Dillon Ave
- 3101 Judson Ave
- 2135 Belmont St
- 3016 Twining Ave
- 3016 Judson Ave