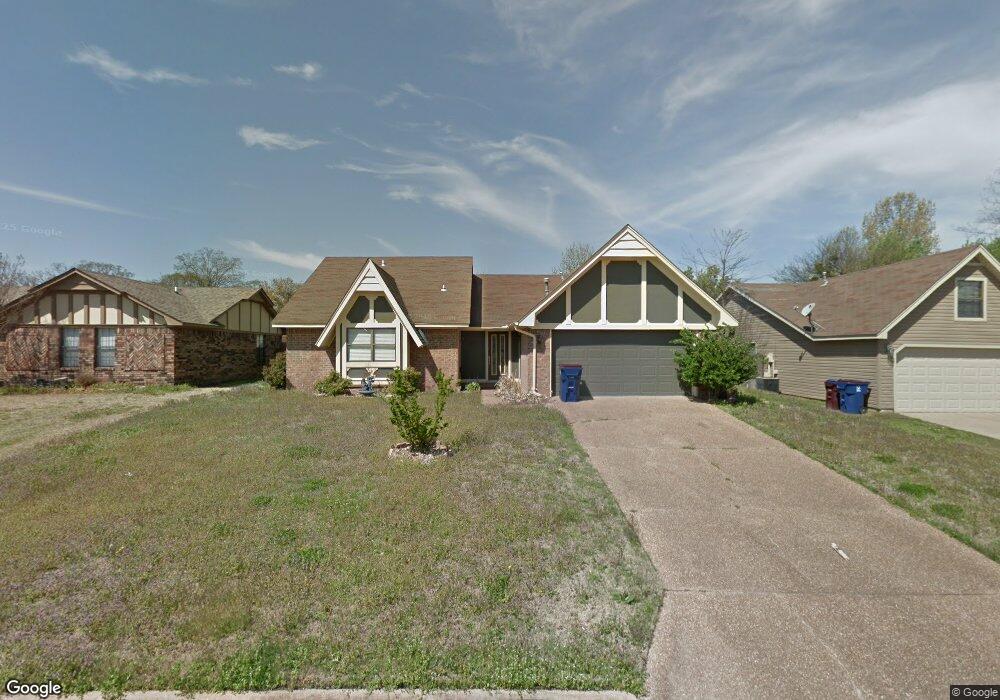
3016 S 99th St Fort Smith, AR 72903
Estimated Value: $221,000 - $231,000
--
Bed
2
Baths
1,605
Sq Ft
$140/Sq Ft
Est. Value
About This Home
This home is located at 3016 S 99th St, Fort Smith, AR 72903 and is currently estimated at $225,376, approximately $140 per square foot. 3016 S 99th St is a home located in Sebastian County with nearby schools including John P. Woods Elementary School, L.A. Chaffin Junior High School, and Southside High School.
Ownership History
Date
Name
Owned For
Owner Type
Purchase Details
Closed on
Jan 28, 2015
Sold by
Kuykendall Marilyn
Bought by
Beckham Trena
Current Estimated Value
Purchase Details
Closed on
Oct 18, 2011
Sold by
Kuykendall Marilyn and Kuykendall R
Bought by
Kuykendall Marilyn and Beckham Trena
Purchase Details
Closed on
Apr 16, 2009
Sold by
Balog Trena and Kuykendall Trena
Bought by
Kuykendall Marilyn
Purchase Details
Closed on
Mar 1, 2005
Sold by
Kuykendall Trena
Bought by
Kuykendall Marilyn and Kuykendall Trena
Purchase Details
Closed on
Jul 7, 1986
Bought by
Baker Jeannie Teresa
Purchase Details
Closed on
Jun 1, 1984
Bought by
Jones Darrell Lee and Jeanie Ly
Purchase Details
Closed on
Dec 30, 1982
Bought by
Fleming Properties
Purchase Details
Closed on
Oct 15, 1979
Bought by
Fleming Realty Co
Create a Home Valuation Report for This Property
The Home Valuation Report is an in-depth analysis detailing your home's value as well as a comparison with similar homes in the area
Home Values in the Area
Average Home Value in this Area
Purchase History
| Date | Buyer | Sale Price | Title Company |
|---|---|---|---|
| Beckham Trena | -- | None Available | |
| Kuykendall Marilyn | -- | None Available | |
| Kuykendall Marilyn | -- | None Available | |
| Kuykendall Marilyn | -- | None Available | |
| Baker Jeannie Teresa | $68,000 | -- | |
| Jones Darrell Lee | $65,000 | -- | |
| Fleming Properties | -- | -- | |
| Fleming Realty Co | -- | -- |
Source: Public Records
Tax History Compared to Growth
Tax History
| Year | Tax Paid | Tax Assessment Tax Assessment Total Assessment is a certain percentage of the fair market value that is determined by local assessors to be the total taxable value of land and additions on the property. | Land | Improvement |
|---|---|---|---|---|
| 2025 | $1,672 | $39,401 | $10,400 | $29,001 |
| 2024 | $1,440 | $27,420 | $8,000 | $19,420 |
| 2023 | $1,440 | $27,420 | $8,000 | $19,420 |
| 2022 | $1,217 | $27,420 | $8,000 | $19,420 |
| 2021 | $1,217 | $27,420 | $8,000 | $19,420 |
| 2020 | $1,199 | $27,420 | $8,000 | $19,420 |
| 2019 | $1,124 | $25,820 | $8,000 | $17,820 |
| 2018 | $1,149 | $25,820 | $8,000 | $17,820 |
| 2017 | $1,006 | $25,820 | $8,000 | $17,820 |
| 2016 | $1,006 | $0 | $0 | $0 |
| 2015 | $1,006 | $25,820 | $8,000 | $17,820 |
| 2014 | $1,053 | $26,730 | $6,400 | $20,330 |
Source: Public Records
Map
Nearby Homes
- 2912 S 100th St
- 3021 S 96th St
- 2908 Riverbend Dr
- 10008 Foxboro Rd
- 10101 Foxboro Rd
- 10112 Meandering Way
- 9313 Enid St
- 9912 Turtle Bay
- 10000 Turtle Bay
- 3001 Brighton Point
- 2411 Wyndermere Way
- 9005 Lakeside Way
- 10717 Hunters Point Rd
- 3004 Lake Overlook Ct
- 10811 Old Harbor Rd
- 3008 Lake Overlook Ct
- 8909 Copper Oaks Ln
- 2811 Brighton Ct
- 8813 Canterbury Cove
- 2401 S 87th Dr
- 3012 S 99th St
- 3020 S 99th St
- 3015 S 98th St
- 3008 S 99th St
- 3100 S 99th St
- 3013 S 99th St
- 3017 S 99th St
- 3009 S 99th St
- 3004 S 99th St
- 3104 S 99th St
- 3005 S 98th Cir
- 3101 S 99th St
- 3005 S 99th St
- 3105 S 99th St
- 3108 S 99th St
- 3000 S 99th St
- 3109 S 98th St
- 3001 S 99th St
- 3001 S 98th Cir
- 3100 S 98th St