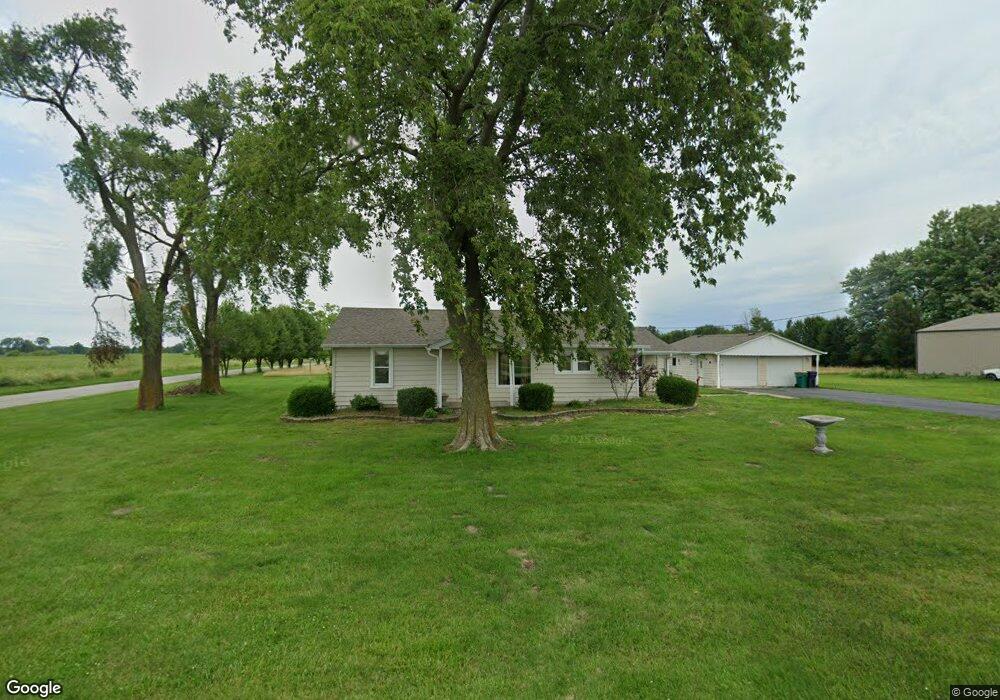
3016 W Saint Louis Bridge Rd Decatur, IL 62521
Estimated Value: $133,000 - $166,114
3
Beds
1
Bath
1,420
Sq Ft
$101/Sq Ft
Est. Value
About This Home
This home is located at 3016 W Saint Louis Bridge Rd, Decatur, IL 62521 and is currently estimated at $143,279, approximately $100 per square foot. 3016 W Saint Louis Bridge Rd is a home located in Macon County with nearby schools including South Shores Elementary School, Stephen Decatur Middle School, and Holy Family Catholic School.
Ownership History
Date
Name
Owned For
Owner Type
Purchase Details
Closed on
Nov 27, 2024
Sold by
Harding Jerold R
Bought by
Giger Trevor Aaron
Current Estimated Value
Home Financials for this Owner
Home Financials are based on the most recent Mortgage that was taken out on this home.
Original Mortgage
$114,000
Outstanding Balance
$113,041
Interest Rate
6.44%
Mortgage Type
New Conventional
Estimated Equity
$30,238
Purchase Details
Closed on
Feb 9, 2021
Sold by
Champion Robert H
Bought by
Harding Jerold R
Purchase Details
Closed on
Oct 22, 2010
Sold by
Jones Lonie L and Jones Bobbie S
Bought by
Champion Robert H
Purchase Details
Closed on
Aug 25, 2006
Sold by
Hawbaker Delores C
Bought by
Jones Lonie L and Jones Bobbie S
Home Financials for this Owner
Home Financials are based on the most recent Mortgage that was taken out on this home.
Original Mortgage
$67,200
Interest Rate
6.88%
Mortgage Type
New Conventional
Create a Home Valuation Report for This Property
The Home Valuation Report is an in-depth analysis detailing your home's value as well as a comparison with similar homes in the area
Home Values in the Area
Average Home Value in this Area
Purchase History
| Date | Buyer | Sale Price | Title Company |
|---|---|---|---|
| Giger Trevor Aaron | $120,000 | None Listed On Document | |
| Harding Jerold R | $100,000 | Central Illinois Title | |
| Champion Robert H | $95,000 | None Available | |
| Jones Lonie L | $84,000 | None Available |
Source: Public Records
Mortgage History
| Date | Status | Borrower | Loan Amount |
|---|---|---|---|
| Open | Giger Trevor Aaron | $114,000 | |
| Previous Owner | Jones Lonie L | $67,200 |
Source: Public Records
Tax History Compared to Growth
Tax History
| Year | Tax Paid | Tax Assessment Tax Assessment Total Assessment is a certain percentage of the fair market value that is determined by local assessors to be the total taxable value of land and additions on the property. | Land | Improvement |
|---|---|---|---|---|
| 2024 | $3,373 | $42,980 | $8,915 | $34,065 |
| 2023 | $3,114 | $39,061 | $8,915 | $30,146 |
| 2022 | $3,004 | $37,265 | $8,505 | $28,760 |
| 2021 | $1,916 | $35,451 | $8,091 | $27,360 |
| 2020 | $293 | $33,602 | $7,669 | $25,933 |
| 2019 | $293 | $33,602 | $7,669 | $25,933 |
| 2018 | $291 | $32,322 | $7,377 | $24,945 |
| 2017 | $1,671 | $32,021 | $7,308 | $24,713 |
| 2016 | $2,160 | $31,954 | $7,293 | $24,661 |
| 2015 | $2,004 | $31,024 | $7,081 | $23,943 |
| 2014 | $1,848 | $30,717 | $7,011 | $23,706 |
| 2013 | $1,849 | $30,717 | $7,011 | $23,706 |
Source: Public Records
Map
Nearby Homes
- 2529 W Alice Ln
- 2207 Forest Crest Dr
- 1739 Moorwood Dr
- 15 Calumet Rd
- 3031 Heritage Rd
- 2705 S Taylor Rd
- 2970 Olympia Dr
- 1833 Burning Tree Dr
- 3316 Ferris Dr
- 1740 S Fairview Ave
- 345 S Westdale Ave
- 353 S Linden Ave
- 1745 Heritage Rd
- 285 S Glencoe Ave
- 310 S Glencoe Ave
- 231 S Redwood Ln
- 248 S Linden Ave
- 170 S Hillcrest Blvd
- 215 S Glencoe Ave
- 198 S Westdale Ave
- 2876 W Saint Louis Bridge Rd
- 2355 Wesley Rd
- 2710 W Saint Louis Bridge Rd
- 2887 W Rock Springs Rd
- 3080 W Rock Springs Rd
- 2620 W Saint Louis Bridge Rd
- 2620 W Saint Louis Bridge Rd
- 2727 W Rock Springs Rd
- 2205 S File Dr
- 2215 S File Dr
- 2225 S File Dr
- 2235 S File Dr
- 2245 S File Dr
- 2655 W Rock Springs Rd
- 2305 S File Dr
- 2315 S File Dr
- 2325 S File Dr
- 2595 W Saint Louis Bridge Rd
- 2335 S File Dr
- 2708 W Rock Springs Rd