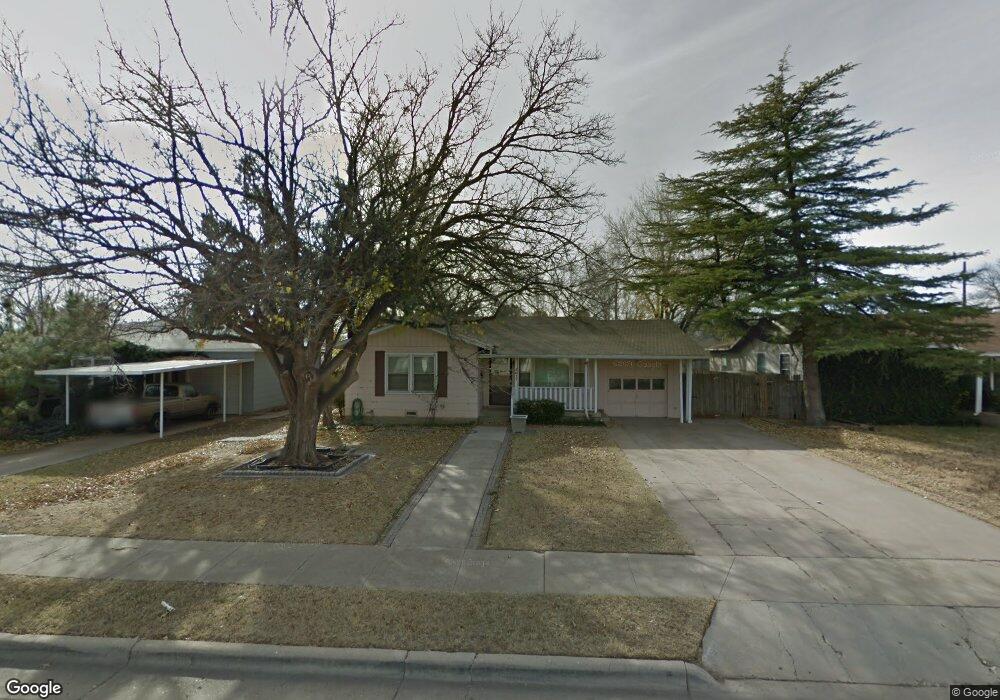
3017 47th St Lubbock, TX 79413
Wheelock & Monterey (WHAM) NeighborhoodEstimated Value: $99,000 - $125,000
2
Beds
1
Bath
983
Sq Ft
$112/Sq Ft
Est. Value
About This Home
This home is located at 3017 47th St, Lubbock, TX 79413 and is currently estimated at $109,725, approximately $111 per square foot. 3017 47th St is a home located in Lubbock County with nearby schools including Wheelock Elementary School, Slaton Middle School, and Monterey High School.
Ownership History
Date
Name
Owned For
Owner Type
Purchase Details
Closed on
Apr 25, 2025
Sold by
Kern Maybelle
Bought by
Kern Robert Kelton
Current Estimated Value
Purchase Details
Closed on
May 23, 2019
Sold by
Mccoy Judie C
Bought by
Kern Robert Kelton and Kern Maybelle
Home Financials for this Owner
Home Financials are based on the most recent Mortgage that was taken out on this home.
Original Mortgage
$35,000
Interest Rate
4.1%
Mortgage Type
Commercial
Purchase Details
Closed on
Feb 1, 1991
Sold by
Clay George W
Bought by
Mccoy Judie C
Purchase Details
Closed on
Jan 25, 1988
Sold by
Clay Julie
Bought by
Mccoy Judie C
Purchase Details
Closed on
Nov 1, 1986
Sold by
Baxley Jo
Bought by
Mccoy Judie C
Create a Home Valuation Report for This Property
The Home Valuation Report is an in-depth analysis detailing your home's value as well as a comparison with similar homes in the area
Home Values in the Area
Average Home Value in this Area
Purchase History
| Date | Buyer | Sale Price | Title Company |
|---|---|---|---|
| Kern Robert Kelton | -- | None Listed On Document | |
| Kern Robert Kelton | -- | None Available | |
| Mccoy Judie C | -- | -- | |
| Mccoy Judie C | -- | -- | |
| Mccoy Judie C | -- | -- |
Source: Public Records
Mortgage History
| Date | Status | Borrower | Loan Amount |
|---|---|---|---|
| Previous Owner | Kern Robert Kelton | $35,000 |
Source: Public Records
Tax History
| Year | Tax Paid | Tax Assessment Tax Assessment Total Assessment is a certain percentage of the fair market value that is determined by local assessors to be the total taxable value of land and additions on the property. | Land | Improvement |
|---|---|---|---|---|
| 2025 | $1,098 | $80,000 | $27,000 | $53,000 |
| 2024 | $1,098 | $120,947 | $27,000 | $93,947 |
| 2023 | $1,975 | $106,223 | $13,200 | $93,023 |
| 2022 | $1,955 | $96,566 | $13,200 | $95,129 |
| 2021 | $1,880 | $87,787 | $13,200 | $77,886 |
| 2020 | $1,735 | $79,806 | $13,200 | $66,606 |
| 2019 | $1,828 | $81,417 | $13,200 | $68,217 |
| 2018 | $1,830 | $81,417 | $13,200 | $68,217 |
| 2017 | $1,796 | $79,806 | $13,200 | $66,606 |
| 2016 | $1,528 | $67,883 | $4,500 | $63,383 |
| 2015 | $1,373 | $64,324 | $4,500 | $59,824 |
| 2014 | $1,373 | $61,760 | $4,500 | $57,260 |
Source: Public Records
Map
Nearby Homes
Your Personal Tour Guide
Ask me questions while you tour the home.