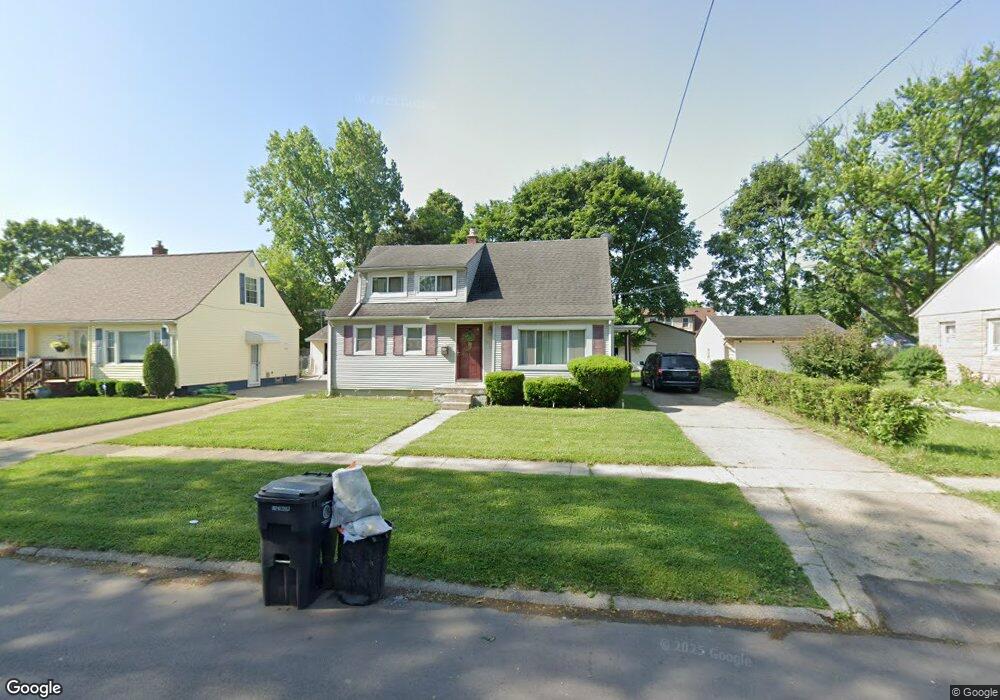
3017 Barth St Flint, MI 48504
Ballenger Highway NeighborhoodEstimated Value: $60,000 - $100,000
3
Beds
2
Baths
1,439
Sq Ft
$55/Sq Ft
Est. Value
About This Home
This home is located at 3017 Barth St, Flint, MI 48504 and is currently estimated at $78,521, approximately $54 per square foot. 3017 Barth St is a home located in Genesee County with nearby schools including Brownell STEM Academy, Greater Heights Academy, and St. Paul Lutheran School.
Ownership History
Date
Name
Owned For
Owner Type
Purchase Details
Closed on
Nov 1, 2007
Sold by
Cooper Aretha A
Bought by
Neal Sandy T
Current Estimated Value
Home Financials for this Owner
Home Financials are based on the most recent Mortgage that was taken out on this home.
Original Mortgage
$51,375
Outstanding Balance
$32,458
Interest Rate
6.44%
Mortgage Type
Purchase Money Mortgage
Estimated Equity
$46,063
Purchase Details
Closed on
May 10, 2006
Sold by
Jackson Alphonso R and Hud
Bought by
Cooper Aretha A and Neal Sandy T
Purchase Details
Closed on
Dec 15, 2005
Sold by
Countrywide Home Loans Inc
Bought by
Hud
Purchase Details
Closed on
Aug 10, 2005
Sold by
Jones Danielle C
Bought by
Countrywide Home Loans Inc
Purchase Details
Closed on
Aug 22, 2001
Sold by
Krueger Lisbeth L
Bought by
Jones Danielle C
Home Financials for this Owner
Home Financials are based on the most recent Mortgage that was taken out on this home.
Original Mortgage
$45,801
Interest Rate
7.03%
Mortgage Type
FHA
Create a Home Valuation Report for This Property
The Home Valuation Report is an in-depth analysis detailing your home's value as well as a comparison with similar homes in the area
Home Values in the Area
Average Home Value in this Area
Purchase History
| Date | Buyer | Sale Price | Title Company |
|---|---|---|---|
| Neal Sandy T | -- | Guaranty Title Company | |
| Cooper Aretha A | $16,517 | Wolverton Title Research Co | |
| Hud | -- | None Available | |
| Countrywide Home Loans Inc | $51,116 | -- | |
| Jones Danielle C | $47,500 | First American Title Ins Co |
Source: Public Records
Mortgage History
| Date | Status | Borrower | Loan Amount |
|---|---|---|---|
| Open | Neal Sandy T | $51,375 | |
| Previous Owner | Jones Danielle C | $45,801 |
Source: Public Records
Tax History
| Year | Tax Paid | Tax Assessment Tax Assessment Total Assessment is a certain percentage of the fair market value that is determined by local assessors to be the total taxable value of land and additions on the property. | Land | Improvement |
|---|---|---|---|---|
| 2025 | $1,131 | $31,300 | $0 | $0 |
| 2024 | $1,048 | $25,800 | $0 | $0 |
| 2023 | $1,024 | $22,900 | $0 | $0 |
| 2022 | $0 | $19,200 | $0 | $0 |
| 2021 | $1,038 | $16,500 | $0 | $0 |
| 2020 | $955 | $13,900 | $0 | $0 |
| 2019 | $934 | $10,300 | $0 | $0 |
| 2018 | $1,027 | $12,000 | $0 | $0 |
| 2017 | $1,000 | $0 | $0 | $0 |
| 2016 | $993 | $0 | $0 | $0 |
| 2015 | -- | $0 | $0 | $0 |
| 2014 | -- | $0 | $0 | $0 |
| 2012 | -- | $15,200 | $0 | $0 |
Source: Public Records
Map
Nearby Homes
- 3101 Barth St
- 3021 Clement St
- 2944 Wolcott St
- 2918 Mackin Rd
- 2902 Prospect St
- 3228 Wolcott St
- 0 Donaldson St
- 2112 Winona St
- 1133 Donaldson St
- 2038 Copeman Blvd
- 2302 Copeman Blvd
- 2622 Concord St
- 1221 Eldorado Dr
- 2612 Concord St
- 2407 Kellar Ave
- 1220 Forest Hill Ave
- 1601 Forest Hill Ave
- 2509 Barth St
- 3071 Devonshire St
- 1315 Welch Blvd
Your Personal Tour Guide
Ask me questions while you tour the home.