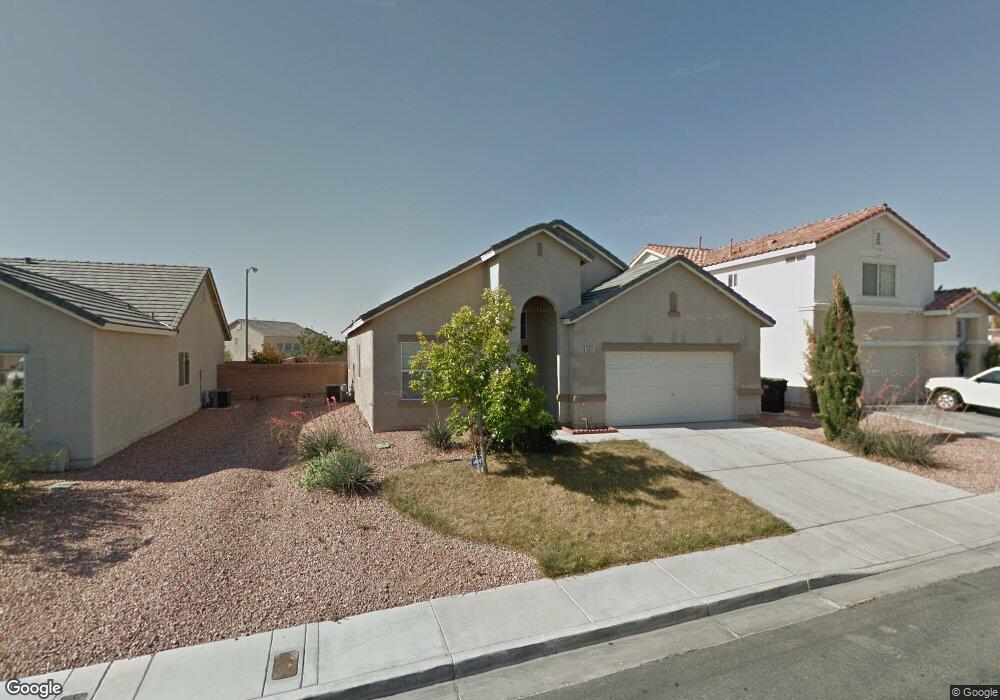
3017 Bayliner Ave North Las Vegas, NV 89031
Craig Ranch NeighborhoodEstimated Value: $406,569 - $419,000
3
Beds
2
Baths
1,696
Sq Ft
$243/Sq Ft
Est. Value
About This Home
This home is located at 3017 Bayliner Ave, North Las Vegas, NV 89031 and is currently estimated at $412,642, approximately $243 per square foot. 3017 Bayliner Ave is a home located in Clark County with nearby schools including Eva G. Simmons Elementary School, Brian & Teri Cram Middle School, and Legacy High School.
Ownership History
Date
Name
Owned For
Owner Type
Purchase Details
Closed on
Apr 21, 2015
Sold by
Csc Fund Llc
Bought by
Roberts Nicholas Elbert and Roberts Leslie Nichole
Current Estimated Value
Home Financials for this Owner
Home Financials are based on the most recent Mortgage that was taken out on this home.
Original Mortgage
$178,762
Outstanding Balance
$137,564
Interest Rate
3.73%
Mortgage Type
VA
Estimated Equity
$275,078
Purchase Details
Closed on
Apr 29, 2011
Sold by
Cerny Maria Fe
Bought by
Csc Fund Llc
Purchase Details
Closed on
Nov 28, 2001
Sold by
Richmond American Homes Of Nevada Inc
Bought by
Cerny Maria Fe
Home Financials for this Owner
Home Financials are based on the most recent Mortgage that was taken out on this home.
Original Mortgage
$137,250
Interest Rate
6.39%
Create a Home Valuation Report for This Property
The Home Valuation Report is an in-depth analysis detailing your home's value as well as a comparison with similar homes in the area
Home Values in the Area
Average Home Value in this Area
Purchase History
| Date | Buyer | Sale Price | Title Company |
|---|---|---|---|
| Roberts Nicholas Elbert | $175,000 | Chicago Title Las Vegas | |
| Csc Fund Llc | $73,711 | Noble Title | |
| Cerny Maria Fe | $144,515 | First American Title Co |
Source: Public Records
Mortgage History
| Date | Status | Borrower | Loan Amount |
|---|---|---|---|
| Open | Roberts Nicholas Elbert | $178,762 | |
| Previous Owner | Cerny Maria Fe | $137,250 |
Source: Public Records
Tax History Compared to Growth
Tax History
| Year | Tax Paid | Tax Assessment Tax Assessment Total Assessment is a certain percentage of the fair market value that is determined by local assessors to be the total taxable value of land and additions on the property. | Land | Improvement |
|---|---|---|---|---|
| 2025 | $1,608 | $102,928 | $32,900 | $70,028 |
| 2024 | $1,562 | $102,928 | $32,900 | $70,028 |
| 2023 | $1,562 | $98,534 | $32,200 | $66,334 |
| 2022 | $1,663 | $87,059 | $26,600 | $60,459 |
| 2021 | $1,540 | $78,771 | $21,350 | $57,421 |
| 2020 | $1,427 | $79,022 | $22,050 | $56,972 |
| 2019 | $1,337 | $74,893 | $18,900 | $55,993 |
| 2018 | $1,276 | $69,304 | $15,400 | $53,904 |
| 2017 | $2,264 | $67,507 | $12,950 | $54,557 |
| 2016 | $1,195 | $57,254 | $8,750 | $48,504 |
| 2015 | $1,192 | $42,488 | $7,000 | $35,488 |
| 2014 | $1,155 | $35,256 | $7,700 | $27,556 |
Source: Public Records
Map
Nearby Homes
- 3106 Saleen Ct
- 5930 Abyss Ct
- 3114 Mastercraft Ave
- 3405 Red Fire Ave
- 6140 Passionate Ct
- 6032 Glitter Gold Ct
- 2707 Gardenia Flower Ave
- 3021 New Journey Way
- 2610 Gardenia Flower Ave
- 3217 Palladio Ave
- 2716 Orchid Moon Ct
- 2426 Inlet Beach Ct
- 3509 Red Fire Ave
- 3107 Sunrise Cove Ave
- 3304 W El Campo Grande Ave
- 3513 Mastercraft Ave
- 3604 Sandy Brown Ave
- 3214 Inlet Bay Ave
- 3217 Bonassola Ave
- 3123 Inlet Bay Ave
- 3013 Bayliner Ave Unit 1
- 3021 Bayliner Ave
- 3009 Bayliner Ave
- 6018 Chris Craft St Unit 2
- 3012 Bayliner Ave
- 3012 Bayliner Ave
- 3005 Bayliner Ave Unit 1
- 5942 Gingham St
- 3105 Bayliner Ave
- 6022 Chris Craft St
- 3008 Bayliner Ave
- 5943 Beeline Ct
- 5939 Beeline Ct
- 3001 Bayliner Ave
- 3104 Bayliner Ave
- 3004 Bayliner Ave Unit 1
- 3109 Bayliner Ave
- 5938 Gingham St
- 6026 Chris Craft St
- 2935 Cafe Racer Ct Unit 1