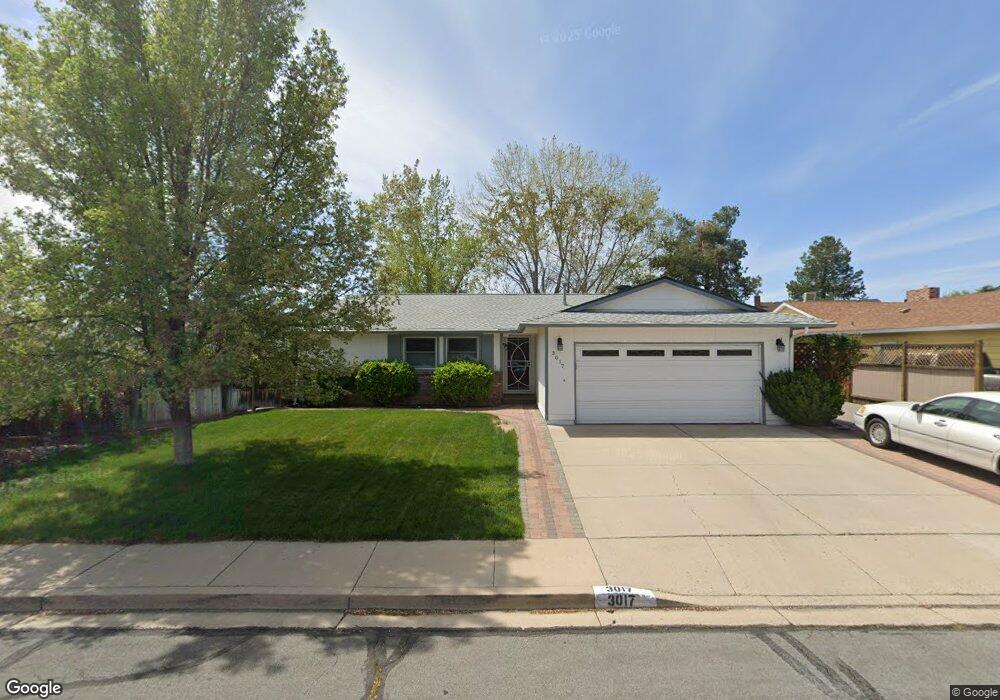
3017 Chollar Cir Sparks, NV 89434
Reed NeighborhoodEstimated Value: $444,000 - $476,000
3
Beds
2
Baths
1,272
Sq Ft
$360/Sq Ft
Est. Value
About This Home
This home is located at 3017 Chollar Cir, Sparks, NV 89434 and is currently estimated at $457,855, approximately $359 per square foot. 3017 Chollar Cir is a home located in Washoe County with nearby schools including Hershal H. Beam Elementary School, Jerry Whitehead Elementary School, and Lou Mendive Middle School.
Ownership History
Date
Name
Owned For
Owner Type
Purchase Details
Closed on
May 30, 2003
Sold by
Greenan Michael Steven J and Greenan Meta J
Bought by
Greenan Michael Steven J and Greenan Meta J
Current Estimated Value
Home Financials for this Owner
Home Financials are based on the most recent Mortgage that was taken out on this home.
Original Mortgage
$141,900
Interest Rate
5.71%
Mortgage Type
Unknown
Purchase Details
Closed on
Jul 13, 2001
Sold by
Greenan Michael Steven J and Greenan Meta J
Bought by
Greenan Michael Steven J and Greenan Meta J
Purchase Details
Closed on
May 19, 1999
Sold by
Rehard Billy D and Rehard Connie I
Bought by
Greenan Michael Steven J and Lee Meta J
Home Financials for this Owner
Home Financials are based on the most recent Mortgage that was taken out on this home.
Original Mortgage
$144,019
Interest Rate
6.92%
Mortgage Type
FHA
Create a Home Valuation Report for This Property
The Home Valuation Report is an in-depth analysis detailing your home's value as well as a comparison with similar homes in the area
Home Values in the Area
Average Home Value in this Area
Purchase History
| Date | Buyer | Sale Price | Title Company |
|---|---|---|---|
| Greenan Michael Steven J | -- | Western Title Incorporated | |
| Greenan Michael Steve J | -- | Western Title Incorporated | |
| Greenan Michael Steven J | -- | -- | |
| Greenan Michael Steven J | $145,000 | First Centennial Title Co |
Source: Public Records
Mortgage History
| Date | Status | Borrower | Loan Amount |
|---|---|---|---|
| Closed | Greenan Michael Steve J | $141,900 | |
| Closed | Greenan Michael Steven J | $144,019 |
Source: Public Records
Tax History Compared to Growth
Tax History
| Year | Tax Paid | Tax Assessment Tax Assessment Total Assessment is a certain percentage of the fair market value that is determined by local assessors to be the total taxable value of land and additions on the property. | Land | Improvement |
|---|---|---|---|---|
| 2025 | $1,971 | $71,856 | $36,120 | $35,736 |
| 2024 | $1,971 | $70,457 | $33,215 | $37,242 |
| 2023 | $1,913 | $70,584 | $35,175 | $35,409 |
| 2022 | $1,859 | $56,788 | $26,740 | $30,048 |
| 2021 | $1,817 | $52,074 | $21,735 | $30,339 |
| 2020 | $1,759 | $51,959 | $20,720 | $31,239 |
| 2019 | $1,708 | $51,474 | $20,720 | $30,754 |
| 2018 | $1,654 | $44,988 | $14,455 | $30,533 |
| 2017 | $1,604 | $44,885 | $13,720 | $31,165 |
| 2016 | $1,563 | $44,412 | $12,250 | $32,162 |
| 2015 | $1,563 | $42,780 | $10,325 | $32,455 |
| 2014 | $1,518 | $42,879 | $9,030 | $33,849 |
| 2013 | -- | $40,478 | $6,860 | $33,618 |
Source: Public Records
Map
Nearby Homes
- 3127 Montezuma Way
- 3253 Clan Alpine Dr
- 1575 Olinghouse St
- 1688 Round Mountain Cir
- 3345 Groom Way
- 2688 Laguna Way
- 2763 Blossom View Dr
- 2407 Sunny Slope Dr Unit 1
- 2252 Sycamore Glen Dr
- 2435 Sycamore Glen Dr Unit 2
- 2479 Napoli Dr
- 1035 Baywood Dr Unit D
- 2372 Napoli Dr
- 1029 Baywood Dr Unit D
- 1069 Palmwood Dr
- 1557 Satellite Dr
- 1128 Bradley Square
- 1990 Fargo Way
- 1770 Burnside Dr
- 2535 Tuscan Way
- 3027 Chollar Cir
- 2968 Lida Ln
- 2968 Lida Ln Unit NV
- 2964 Lida Ln
- 2972 Lida Ln
- 3037 Chollar Cir
- 2976 Lida Ln
- 3010 Chollar Cir
- 3020 Chollar Cir
- 2974 Lida Ln
- 3030 Chollar Cir
- 3047 Chollar Cir Unit 1B
- 3040 Chollar Cir
- 2980 Lida Ln
- 2971 Lida Ln
- 2963 Lida Ln
- 2959 Lida Ln Unit 1B
- 2961 Lida Ln
- 2973 Lida Ln
- 3015 Round Mountain Rd