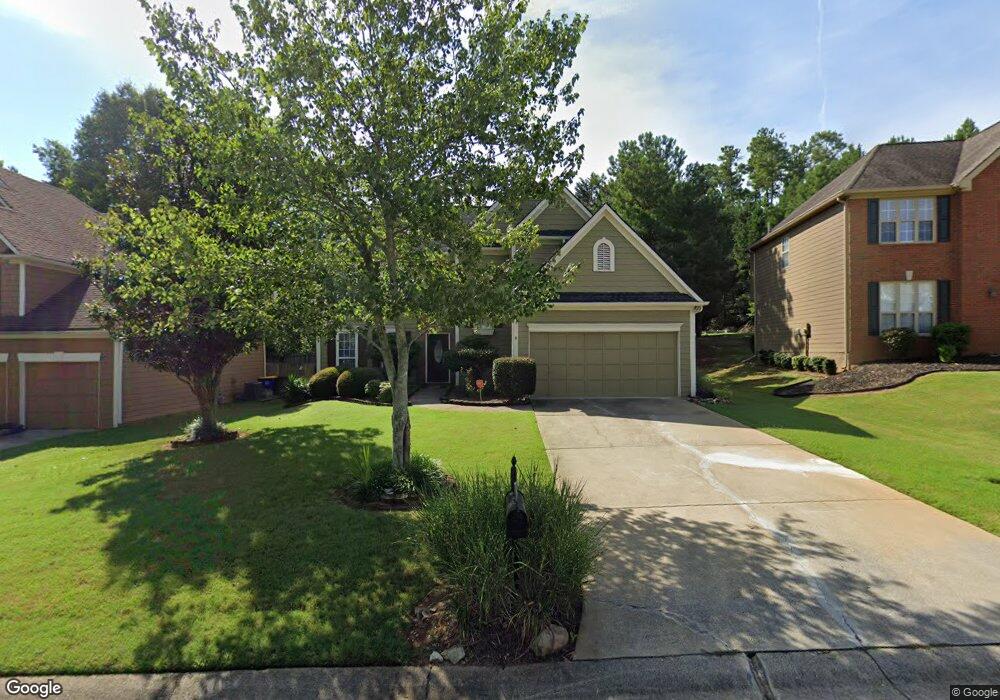
3017 Cranbrook Walk NW Unit 118 Kennesaw, GA 30144
Estimated Value: $398,000 - $431,000
4
Beds
3
Baths
2,162
Sq Ft
$193/Sq Ft
Est. Value
About This Home
This home is located at 3017 Cranbrook Walk NW Unit 118, Kennesaw, GA 30144 and is currently estimated at $416,874, approximately $192 per square foot. 3017 Cranbrook Walk NW Unit 118 is a home located in Cobb County with nearby schools including Kennesaw Elementary School, Big Shanty Elementary School, and Awtrey Middle School.
Ownership History
Date
Name
Owned For
Owner Type
Purchase Details
Closed on
Nov 22, 2024
Sold by
Pham Hoang-Thanh Thi and Pham Thank H
Bought by
Ali Umair Anis
Current Estimated Value
Home Financials for this Owner
Home Financials are based on the most recent Mortgage that was taken out on this home.
Original Mortgage
$314,206
Outstanding Balance
$311,194
Interest Rate
6.32%
Mortgage Type
New Conventional
Estimated Equity
$105,680
Purchase Details
Closed on
Jul 25, 2017
Sold by
Dunning Jonathan S
Bought by
Pham Thanh H
Purchase Details
Closed on
Mar 26, 2004
Sold by
Bibi Tarek
Bought by
Dunning Jonathan S and Roberts Samantha
Home Financials for this Owner
Home Financials are based on the most recent Mortgage that was taken out on this home.
Original Mortgage
$33,000
Interest Rate
5.55%
Mortgage Type
Stand Alone Refi Refinance Of Original Loan
Purchase Details
Closed on
Apr 25, 1996
Sold by
S G Torrey Atlata Ltd
Bought by
Bibi Tarek
Create a Home Valuation Report for This Property
The Home Valuation Report is an in-depth analysis detailing your home's value as well as a comparison with similar homes in the area
Home Values in the Area
Average Home Value in this Area
Purchase History
| Date | Buyer | Sale Price | Title Company |
|---|---|---|---|
| Ali Umair Anis | $408,000 | None Listed On Document | |
| Pham Thanh H | $223,000 | -- | |
| Dunning Jonathan S | $165,100 | -- | |
| Bibi Tarek | $136,300 | -- |
Source: Public Records
Mortgage History
| Date | Status | Borrower | Loan Amount |
|---|---|---|---|
| Open | Ali Umair Anis | $314,206 | |
| Previous Owner | Dunning Jonathan S | $33,000 | |
| Closed | Bibi Tarek | $0 |
Source: Public Records
Tax History Compared to Growth
Tax History
| Year | Tax Paid | Tax Assessment Tax Assessment Total Assessment is a certain percentage of the fair market value that is determined by local assessors to be the total taxable value of land and additions on the property. | Land | Improvement |
|---|---|---|---|---|
| 2025 | $4,506 | $161,720 | $40,000 | $121,720 |
| 2024 | $1,023 | $150,432 | $22,000 | $128,432 |
| 2023 | $817 | $150,432 | $22,000 | $128,432 |
| 2022 | $989 | $139,148 | $22,000 | $117,148 |
| 2021 | $884 | $104,124 | $22,000 | $82,124 |
| 2020 | $866 | $98,188 | $22,000 | $76,188 |
| 2019 | $835 | $87,804 | $16,000 | $71,804 |
| 2018 | $2,306 | $87,804 | $16,000 | $71,804 |
| 2017 | $1,896 | $77,716 | $16,000 | $61,716 |
| 2016 | $1,898 | $77,716 | $16,000 | $61,716 |
| 2015 | $1,773 | $70,080 | $16,000 | $54,080 |
| 2014 | $1,644 | $64,152 | $0 | $0 |
Source: Public Records
Map
Nearby Homes
- 3164 Hartness Way NW Unit 6B
- 3966 Lullwater Main NW
- 3962 Lullwater Main NW
- 3143 Forest Grove Trail NW
- 4157 Berkeley Landing NW
- 3813 Seattle Place NW
- 3910 Collier Trace NW
- 3182 Mckinley Ct
- 3038 Fairhaven Ridge NW
- 3104 Redwood Ln NW
- 3305 McEver Woods Cir NW
- 4026 Mcdowell Dr
- 2983 Bancroft Glen NW
- 3131 Kirkwood Dr NW
- 3294 McEver Park Cir
- 3299 McEver Park Cir
- 4032 Mcpherson Dr
- 3324 Whitmore Ct
- 4166 McEver Park Dr
- 4160 McEver Park Dr
- 3017 Cranbrook Walk NW
- 3019 Cranbrook Walk NW
- 3042 Langley Close NW
- 3013 Cranbrook Walk NW
- 0 Cranbrook Walk
- 3021 Cranbrook Walk NW
- 3040 Langley Close NW
- 3020 Cranbrook Walk NW
- 3044 Langley Close NW
- 3018 Cranbrook Walk NW
- 3018 Cranbrook Walk NW
- 3018 Cranbrook Walk NW Unit 3018
- 3016 Cranbrook Walk NW
- 3022 Cranbrook Walk NW
- 3011 Cranbrook Walk NW
- 3023 Cranbrook Walk NW
- 3014 Cranbrook Walk NW
- 3038 Langley Close NW Unit 105
- 3038 Langley Close NW
- 3043 Langley Close NW