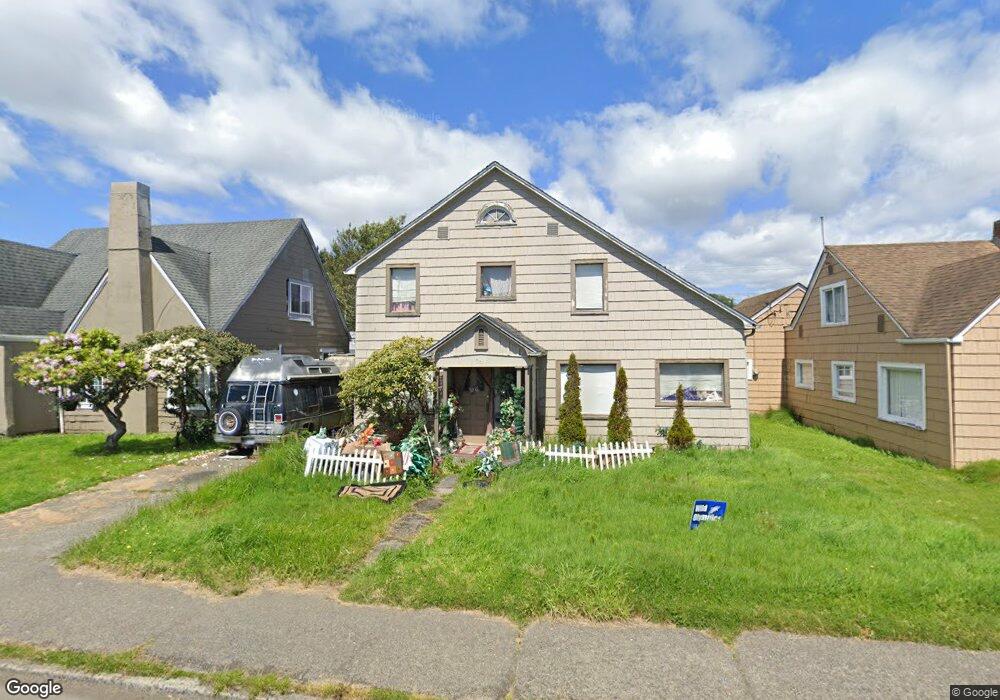
3017 Simpson Ave Hoquiam, WA 98550
Estimated Value: $254,000 - $323,000
4
Beds
2
Baths
2,256
Sq Ft
$131/Sq Ft
Est. Value
About This Home
This home is located at 3017 Simpson Ave, Hoquiam, WA 98550 and is currently estimated at $295,677, approximately $131 per square foot. 3017 Simpson Ave is a home located in Grays Harbor County with nearby schools including Lincoln Elementary School, Emerson Elementary School, and Central Elementary School.
Ownership History
Date
Name
Owned For
Owner Type
Purchase Details
Closed on
Mar 25, 2009
Sold by
Saxon Mortgage Services Inc
Bought by
Anderson Gail D
Current Estimated Value
Purchase Details
Closed on
Jan 11, 2008
Sold by
Hebel Patrice
Bought by
Saxon Mortgage Services Inc
Purchase Details
Closed on
Jun 12, 2006
Sold by
Brutsche Leo C and Brutsche Norma J
Bought by
Hebel Patrice
Home Financials for this Owner
Home Financials are based on the most recent Mortgage that was taken out on this home.
Original Mortgage
$16,500
Interest Rate
6.55%
Mortgage Type
Stand Alone Second
Purchase Details
Closed on
May 24, 2006
Sold by
Hebel Bernard
Bought by
Hebel Patrice
Home Financials for this Owner
Home Financials are based on the most recent Mortgage that was taken out on this home.
Original Mortgage
$16,500
Interest Rate
6.55%
Mortgage Type
Stand Alone Second
Create a Home Valuation Report for This Property
The Home Valuation Report is an in-depth analysis detailing your home's value as well as a comparison with similar homes in the area
Home Values in the Area
Average Home Value in this Area
Purchase History
| Date | Buyer | Sale Price | Title Company |
|---|---|---|---|
| Anderson Gail D | $48,500 | Coast Title | |
| Saxon Mortgage Services Inc | $93,500 | Grays Harbor Title | |
| Hebel Patrice | $110,000 | Grays Harbor Title | |
| Hebel Patrice | -- | Grays Harbor Title |
Source: Public Records
Mortgage History
| Date | Status | Borrower | Loan Amount |
|---|---|---|---|
| Previous Owner | Hebel Patrice | $16,500 | |
| Previous Owner | Hebel Patrice | $93,500 | |
| Previous Owner | Hebel Patrice | $16,500 |
Source: Public Records
Tax History Compared to Growth
Tax History
| Year | Tax Paid | Tax Assessment Tax Assessment Total Assessment is a certain percentage of the fair market value that is determined by local assessors to be the total taxable value of land and additions on the property. | Land | Improvement |
|---|---|---|---|---|
| 2025 | $316 | $219,646 | $22,680 | $196,966 |
| 2023 | $324 | $189,827 | $22,680 | $167,147 |
| 2022 | $387 | $164,891 | $12,600 | $152,291 |
| 2021 | $1,819 | $164,891 | $12,600 | $152,291 |
| 2020 | $1,594 | $134,433 | $12,600 | $121,833 |
| 2019 | $1,295 | $114,128 | $12,600 | $101,528 |
| 2018 | $1,276 | $97,206 | $12,600 | $84,606 |
| 2017 | $1,216 | $80,285 | $12,600 | $67,685 |
| 2016 | $1,252 | $80,285 | $12,600 | $67,685 |
| 2014 | -- | $83,165 | $12,600 | $70,565 |
| 2013 | -- | $81,490 | $34,650 | $46,840 |
Source: Public Records
Map
Nearby Homes
- 3023 Aberdeen Ave
- 3102 Simpson Ave
- 2921 Aberdeen Ave
- 2934 Cherry St
- 3114 Aberdeen Ave
- 2835 Pacific Ave
- 2826 Pacific Ave
- 519 28th St
- 2732 Aberdeen Ave
- 2735 Bay Ave
- 2719 Pacific Ave
- 2712 Cherry St
- 2404 Sumner Ave
- 2621 Sumner Ave
- 2640 Queets Ave
- 2643 Queets Ave
- 2310 Simpson Ave
- 215 Ontario St
- 110 Ontario St
- 2218 W 5th St
- 3021 Simpson Ave
- 3015 Simpson Ave
- 3025 Simpson Ave
- 3022 Sumner Ave
- 3018 Sumner Ave
- 3014 Sumner Ave
- 3005 Simpson Ave
- 3026 Sumner Ave
- 3010 Sumner Ave
- 3016 Simson Ave
- 3014 Simpson Ave
- 3030 Sumner Ave
- 3026 Simpson Ave
- 309 30th St
- 3010 Simpson Ave
- 3004 Sumner Ave
- 3006 Simpson Ave
- 3034 Sumner Ave
- 3002 Sumner Ave
- 301 30th St