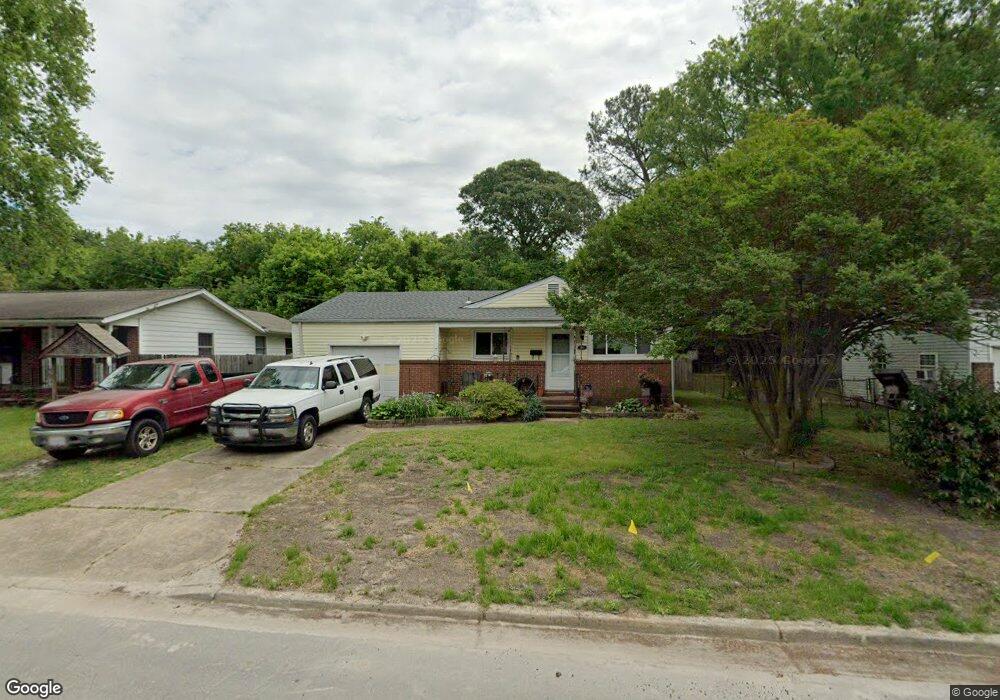
3017 Southport Ave Chesapeake, VA 23324
South Norfolk NeighborhoodEstimated Value: $219,000 - $275,000
3
Beds
1
Bath
864
Sq Ft
$276/Sq Ft
Est. Value
About This Home
This home is located at 3017 Southport Ave, Chesapeake, VA 23324 and is currently estimated at $238,369, approximately $275 per square foot. 3017 Southport Ave is a home located in Chesapeake City with nearby schools including Portlock Primary School, George W. Carver Intermediate School, and Oscar Smith Middle School.
Ownership History
Date
Name
Owned For
Owner Type
Purchase Details
Closed on
Nov 20, 2019
Sold by
Goldberg Michael H
Bought by
Rme Properties
Current Estimated Value
Purchase Details
Closed on
Mar 14, 2017
Sold by
Didomenico Kristin
Bought by
Goldberg Michael H
Home Financials for this Owner
Home Financials are based on the most recent Mortgage that was taken out on this home.
Original Mortgage
$69,300
Interest Rate
4.19%
Mortgage Type
New Conventional
Purchase Details
Closed on
May 27, 2011
Sold by
Federal National Mortgage Association
Bought by
Didomenico Kristin
Home Financials for this Owner
Home Financials are based on the most recent Mortgage that was taken out on this home.
Original Mortgage
$97,367
Interest Rate
4.12%
Mortgage Type
FHA
Purchase Details
Closed on
Apr 26, 2006
Sold by
Peesek John A
Bought by
Phillips Anita M
Home Financials for this Owner
Home Financials are based on the most recent Mortgage that was taken out on this home.
Original Mortgage
$148,000
Interest Rate
6.53%
Mortgage Type
New Conventional
Create a Home Valuation Report for This Property
The Home Valuation Report is an in-depth analysis detailing your home's value as well as a comparison with similar homes in the area
Home Values in the Area
Average Home Value in this Area
Purchase History
| Date | Buyer | Sale Price | Title Company |
|---|---|---|---|
| Rme Properties | -- | None Available | |
| Goldberg Michael H | $99,000 | Advance Title & Abstract Inc | |
| Didomenico Kristin | $99,900 | -- | |
| Phillips Anita M | $185,000 | -- |
Source: Public Records
Mortgage History
| Date | Status | Borrower | Loan Amount |
|---|---|---|---|
| Previous Owner | Goldberg Michael H | $69,300 | |
| Previous Owner | Didomenico Kristin | $97,367 | |
| Previous Owner | Phillips Anita M | $148,000 |
Source: Public Records
Tax History Compared to Growth
Tax History
| Year | Tax Paid | Tax Assessment Tax Assessment Total Assessment is a certain percentage of the fair market value that is determined by local assessors to be the total taxable value of land and additions on the property. | Land | Improvement |
|---|---|---|---|---|
| 2025 | $1,962 | $213,000 | $110,000 | $103,000 |
| 2024 | $1,962 | $194,300 | $100,000 | $94,300 |
| 2023 | $1,625 | $172,700 | $90,000 | $82,700 |
| 2022 | $1,609 | $159,300 | $80,000 | $79,300 |
| 2021 | $1,538 | $146,500 | $65,000 | $81,500 |
| 2020 | $1,449 | $138,000 | $60,000 | $78,000 |
| 2019 | $1,449 | $138,000 | $60,000 | $78,000 |
| 2018 | $1,513 | $144,100 | $55,000 | $89,100 |
| 2017 | $1,428 | $136,000 | $55,000 | $81,000 |
| 2016 | $1,428 | $136,000 | $55,000 | $81,000 |
| 2015 | $1,411 | $134,400 | $55,000 | $79,400 |
| 2014 | $1,411 | $134,400 | $55,000 | $79,400 |
Source: Public Records
Map
Nearby Homes
- 3011 Southport Ave
- 3207 Walden St
- 1244 Bell Tower Arch
- 1900 Varsity Dr
- 1306 Edgewood Ave
- 1819 Warfield St
- 1209 Anne Ave
- 1208 Edgewood Ave
- 2105 Portlock Rd
- 2512 Chesapeake Ave
- 436 Clemson Ave
- 1127 Ferebee Ave
- 4111 Williamson St
- 1403 Freeman Ave
- 1201 Country Rd
- 2648 Westwood Ave
- 4121 Everett St
- 900 Avalon Ave
- 2144 Campostella Rd
- 4130 Everett St
- 3019 Southport Ave
- 3013 Southport Ave
- 3023 Southport Ave
- 3021 Southport Ave
- 3012 Southport Ave
- 3010 Southport Ave
- 3014 Southport Ave
- 3016 Southport Ave
- 3009 Southport Ave
- 3008 Southport Ave
- 3018 Southport Ave
- 3006 Southport Ave
- 3007 Southport Ave
- 3121 Pelham St
- 3125 Pelham St
- 3117 Pelham St
- 3020 Southport Ave
- 3004 Southport Ave
- 3129 Pelham St
- 3113 Pelham St