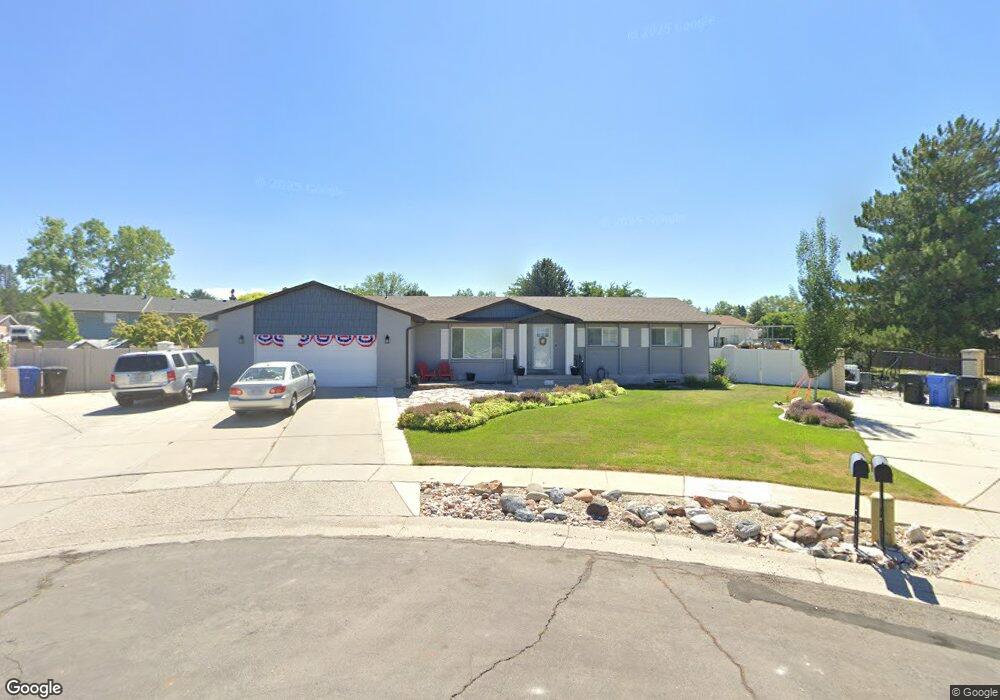
3017 W Sierra Grande Ct Taylorsville, UT 84129
Estimated Value: $658,000 - $693,000
5
Beds
3
Baths
3,220
Sq Ft
$209/Sq Ft
Est. Value
About This Home
This home is located at 3017 W Sierra Grande Ct, Taylorsville, UT 84129 and is currently estimated at $674,314, approximately $209 per square foot. 3017 W Sierra Grande Ct is a home located in Salt Lake County with nearby schools including Bennion Elementary School, Bennion Junior High School, and Taylorsville High School.
Ownership History
Date
Name
Owned For
Owner Type
Purchase Details
Closed on
Aug 23, 2021
Sold by
Christensen Jill S and Christensen Glenn T
Bought by
Wall Keven Duane and Wall Cary Ann
Current Estimated Value
Home Financials for this Owner
Home Financials are based on the most recent Mortgage that was taken out on this home.
Original Mortgage
$480,000
Outstanding Balance
$435,147
Interest Rate
2.7%
Mortgage Type
New Conventional
Estimated Equity
$239,167
Purchase Details
Closed on
Apr 22, 2009
Sold by
Christensen Glenn T and Christensen Jill S
Bought by
Christensen Jill S and Christensen Glenn T
Home Financials for this Owner
Home Financials are based on the most recent Mortgage that was taken out on this home.
Original Mortgage
$145,250
Interest Rate
4.64%
Mortgage Type
New Conventional
Create a Home Valuation Report for This Property
The Home Valuation Report is an in-depth analysis detailing your home's value as well as a comparison with similar homes in the area
Home Values in the Area
Average Home Value in this Area
Purchase History
| Date | Buyer | Sale Price | Title Company |
|---|---|---|---|
| Wall Keven Duane | -- | Investors Title Ins Agency | |
| Christensen Jill S | -- | First American Title |
Source: Public Records
Mortgage History
| Date | Status | Borrower | Loan Amount |
|---|---|---|---|
| Open | Wall Keven Duane | $480,000 | |
| Previous Owner | Christensen Jill S | $145,250 |
Source: Public Records
Tax History Compared to Growth
Tax History
| Year | Tax Paid | Tax Assessment Tax Assessment Total Assessment is a certain percentage of the fair market value that is determined by local assessors to be the total taxable value of land and additions on the property. | Land | Improvement |
|---|---|---|---|---|
| 2025 | $3,966 | $640,300 | $183,100 | $457,200 |
| 2024 | $3,966 | $601,400 | $172,900 | $428,500 |
| 2023 | $3,253 | $523,300 | $166,200 | $357,100 |
| 2022 | $3,325 | $539,500 | $163,000 | $376,500 |
| 2021 | $532 | $422,200 | $125,400 | $296,800 |
| 2020 | $4 | $370,100 | $114,500 | $255,600 |
| 2019 | $103 | $356,700 | $101,400 | $255,300 |
| 2018 | $2,633 | $331,500 | $101,400 | $230,100 |
| 2017 | $2,271 | $300,600 | $101,400 | $199,200 |
| 2016 | $2,095 | $277,100 | $101,400 | $175,700 |
| 2015 | $1,927 | $238,200 | $106,700 | $131,500 |
| 2014 | $1,827 | $221,800 | $100,500 | $121,300 |
Source: Public Records
Map
Nearby Homes
- 5980 S Sweet Basil N
- 3075 Don Francisco Dr Unit 159
- 6007 S Sweet Basil N
- 3002 Carranza Dr
- 6095 S Sierra Grande Dr
- 6016 S Paprika Cir
- 5748 2730 West St
- 1824 W 6200 S
- 5597 S Bastile Dr
- 5600 S Ralph Dr
- 5725 S 2665 W
- 3117 W 6250 S
- 5539 S Danube Dr
- 2579 W 5780 S
- 3088 W Cisco Ridge Rd
- 6215 S Westbrook Dr
- 5574 Easton St
- 5668 Lolene Way
- 3052 W Matterhorn Dr
- 6222 S Westbrook Dr
- 3017 Sierra Grande Ct
- 3020 W Sierra Grande Ct
- 3020 Sierra Grande Ct
- 3032 Rosa Vista Dr
- 3020 Rosa Vista Dr
- 3007 Sierra Grande Ct
- 3046 Rosa Vista Dr
- 3006 Rosa Vista Dr
- 3006 W Sierra Grande Ct
- 3006 Sierra Grande Ct
- 2991 Sierra Grande Ct
- 5897 Rosa Vista Dr
- 5918 S Sierra Grande Dr
- 5918 Sierra Grande Dr
- 2990 Sierra Grande Ct
- 3031 Rosa Vista Dr
- 2990 W Sierra Grande Ct
- 3043 W Rosa Vista Dr
- 3043 Rosa Vista Dr
- 3021 Rosa Vista Dr