3017 Williams Rd Columbus, OH 43207
Obetz-Lockbourne NeighborhoodEstimated Value: $256,000 - $325,000
3
Beds
2
Baths
1,780
Sq Ft
$165/Sq Ft
Est. Value
About This Home
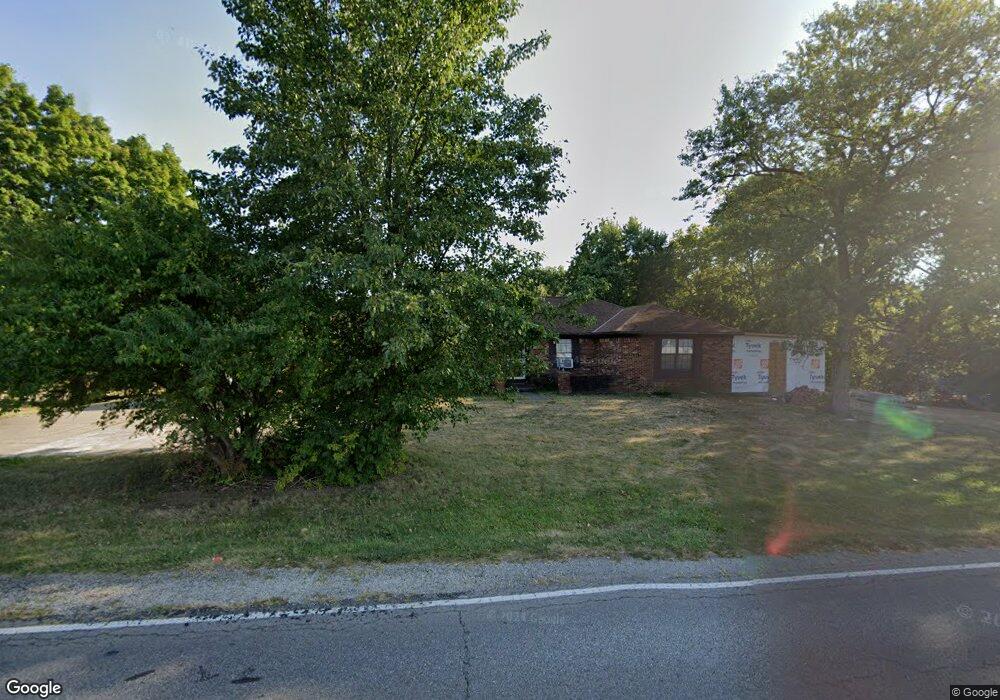
This home is located at 3017 Williams Rd, Columbus, OH 43207 and is currently estimated at $292,892, approximately $164 per square foot. 3017 Williams Rd is a home located in Franklin County with nearby schools including Groveport Madison High School, South Columbus Preparatory Academy at Southfield, and South Scioto Academy.
Ownership History
Date
Name
Owned For
Owner Type
Purchase Details
Closed on
Nov 25, 2008
Sold by
Fifth Third Bank
Bought by
Odunaiya Folu and Odunaiya Simbo
Current Estimated Value
Home Financials for this Owner
Home Financials are based on the most recent Mortgage that was taken out on this home.
Original Mortgage
$136,035
Outstanding Balance
$87,646
Interest Rate
5.96%
Mortgage Type
FHA
Estimated Equity
$205,246
Purchase Details
Closed on
Jun 19, 2008
Sold by
Hayslip Lester L and Case #07Cve02 1747
Bought by
Fifth Third Bank and Fifth Third Bank Central Ohio
Purchase Details
Closed on
Jul 22, 1999
Sold by
Hayslip Lester L and Hayslip Frances A
Bought by
Hayslip Lester L and Hayslip Frances A
Purchase Details
Closed on
Jun 21, 1979
Bought by
Hayslip Lester L
Create a Home Valuation Report for This Property
The Home Valuation Report is an in-depth analysis detailing your home's value as well as a comparison with similar homes in the area
Home Values in the Area
Average Home Value in this Area
Purchase History
| Date | Buyer | Sale Price | Title Company |
|---|---|---|---|
| Odunaiya Folu | $70,100 | Prism Title & Closing Servic | |
| Fifth Third Bank | $96,000 | None Available | |
| Hayslip Lester L | -- | -- | |
| Hayslip Lester L | -- | -- |
Source: Public Records
Mortgage History
| Date | Status | Borrower | Loan Amount |
|---|---|---|---|
| Open | Odunaiya Folu | $136,035 |
Source: Public Records
Tax History
| Year | Tax Paid | Tax Assessment Tax Assessment Total Assessment is a certain percentage of the fair market value that is determined by local assessors to be the total taxable value of land and additions on the property. | Land | Improvement |
|---|---|---|---|---|
| 2025 | $4,334 | $102,200 | $37,170 | $65,030 |
| 2024 | $4,334 | $102,200 | $37,170 | $65,030 |
| 2023 | $4,292 | $102,200 | $37,170 | $65,030 |
| 2022 | $3,372 | $66,780 | $25,970 | $40,810 |
| 2021 | $3,382 | $66,780 | $25,970 | $40,810 |
| 2020 | $3,388 | $66,780 | $25,970 | $40,810 |
| 2019 | $3,372 | $59,470 | $22,610 | $36,860 |
| 2018 | $2,947 | $59,470 | $22,610 | $36,860 |
| 2017 | $2,939 | $59,470 | $22,610 | $36,860 |
| 2016 | $2,473 | $39,480 | $5,600 | $33,880 |
| 2015 | $2,500 | $39,480 | $5,600 | $33,880 |
| 2014 | $2,528 | $39,480 | $5,600 | $33,880 |
| 2013 | $1,113 | $41,545 | $5,880 | $35,665 |
Source: Public Records
Map
Nearby Homes
- 3968 Briarbush Dr
- 3782 Willowtree Ln
- 3950 Wintercress Ct
- 4050 Millview Ct
- 3724 Revolutionary Dr Unit 111
- 3622 Pendent Ln
- 4142 Oldentime Ct
- 0 Alum Creek Dr Unit 225007823
- 2629 Patrick Henry Ave Unit 40
- 2318 Rodger Rd
- 2222 Maureen Blvd S
- 2697 Meigs Dr
- 2693 Meigs Dr
- 2689 Meigs Dr
- 2685 Meigs Dr
- 2681 Meigs Dr
- 3242 Mackinac Dr
- 2686 Meigs Dr
- 2690 Meigs Dr
- 2682 Meigs Dr
- 3025 Williams Rd
- 3878 Barley Cir
- 2953 Williams Rd
- 3885 Barley Cir
- 3051 Williams Rd
- 3890 Barley Cir
- 2678 Bonne Cir
- 2945 Williams Rd
- 3893 Barley Cir
- 2616 Weeping Willow Ct
- 3881 Bayberry Cir
- 2599 Weeping Willow Ct
- 3901 Barley Cir
- 3061 Williams Rd
- 2610 Weeping Willow Ct
- 3887 Bayberry Cir
- 3911 Barley Cir
- 2885 Williams Rd
- 0 Williams Rd
Your Personal Tour Guide
Ask me questions while you tour the home.