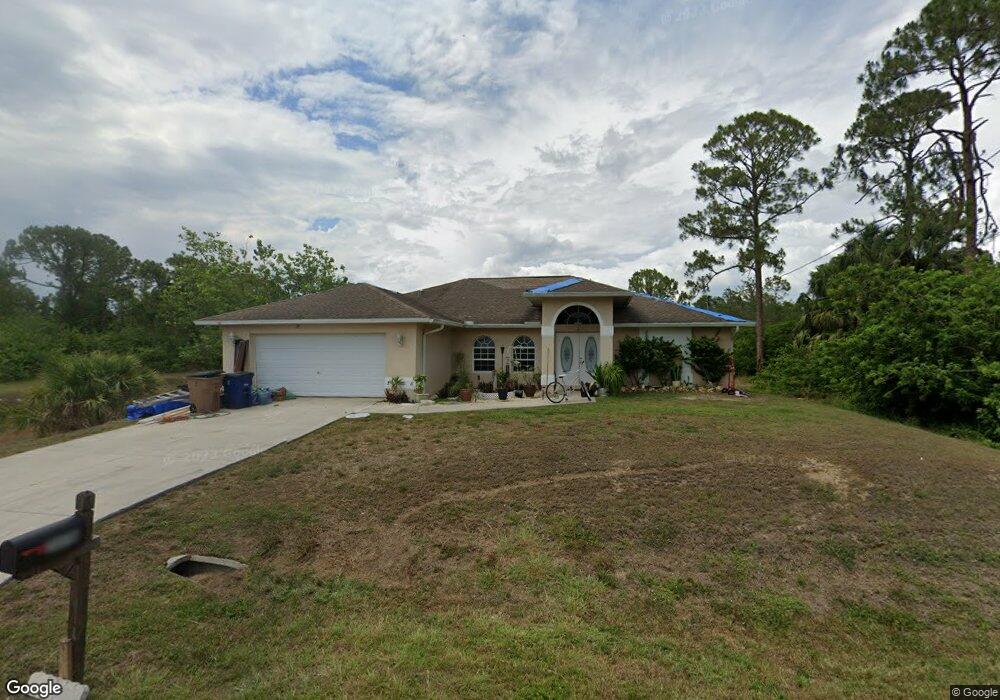
3018 16th St W Unit 4 Lehigh Acres, FL 33971
Richmond NeighborhoodEstimated Value: $279,000 - $338,000
3
Beds
2
Baths
1,992
Sq Ft
$155/Sq Ft
Est. Value
About This Home
This home is located at 3018 16th St W Unit 4, Lehigh Acres, FL 33971 and is currently estimated at $309,721, approximately $155 per square foot. 3018 16th St W Unit 4 is a home located in Lee County with nearby schools including Lehigh Elementary School, Gateway Elementary School, and Tice Elementary School.
Ownership History
Date
Name
Owned For
Owner Type
Purchase Details
Closed on
Jan 13, 2021
Sold by
Dare Peggy M
Bought by
Sharp Peggy Dare and Peggy Dare Sharp Revocable Tru
Current Estimated Value
Purchase Details
Closed on
Oct 29, 2010
Sold by
Bowles Patrick and Bowles Angelina
Bought by
Dare Peggy M
Purchase Details
Closed on
May 26, 2006
Sold by
Samadnejad David
Bought by
Bowles Patrick and Bowles Angelina
Home Financials for this Owner
Home Financials are based on the most recent Mortgage that was taken out on this home.
Original Mortgage
$207,920
Interest Rate
6.49%
Mortgage Type
Unknown
Purchase Details
Closed on
Nov 30, 2004
Sold by
Holder Keith and Lewis Lyncoln
Bought by
Samadnejad Davoud
Purchase Details
Closed on
Oct 17, 2002
Sold by
Siev Inc
Bought by
Holder Keith and Lewis Lyncoln
Home Financials for this Owner
Home Financials are based on the most recent Mortgage that was taken out on this home.
Original Mortgage
$4,000
Interest Rate
5.95%
Create a Home Valuation Report for This Property
The Home Valuation Report is an in-depth analysis detailing your home's value as well as a comparison with similar homes in the area
Home Values in the Area
Average Home Value in this Area
Purchase History
| Date | Buyer | Sale Price | Title Company |
|---|---|---|---|
| Sharp Peggy Dare | -- | Accommodation | |
| Dare Peggy M | $50,200 | Florida Land Title Services | |
| Bowles Patrick | $259,900 | Attorney | |
| Samadnejad Davoud | $23,000 | Title Professionals Of Fl | |
| Holder Keith | $4,500 | -- |
Source: Public Records
Mortgage History
| Date | Status | Borrower | Loan Amount |
|---|---|---|---|
| Previous Owner | Bowles Patrick | $207,920 | |
| Previous Owner | Holder Keith | $4,000 |
Source: Public Records
Tax History Compared to Growth
Tax History
| Year | Tax Paid | Tax Assessment Tax Assessment Total Assessment is a certain percentage of the fair market value that is determined by local assessors to be the total taxable value of land and additions on the property. | Land | Improvement |
|---|---|---|---|---|
| 2025 | $3,800 | $238,370 | $20,188 | $218,182 |
| 2024 | $3,800 | $249,224 | $17,791 | $231,433 |
| 2023 | $3,800 | $248,162 | $0 | $0 |
| 2022 | $3,378 | $225,599 | $9,622 | $215,977 |
| 2021 | $2,363 | $165,190 | $5,700 | $159,490 |
| 2020 | $2,274 | $155,046 | $5,200 | $149,846 |
| 2019 | $2,243 | $154,230 | $5,400 | $148,830 |
| 2018 | $2,118 | $142,115 | $5,100 | $137,015 |
| 2017 | $2,028 | $135,667 | $5,100 | $130,567 |
| 2016 | $1,842 | $114,445 | $5,100 | $109,345 |
| 2015 | $1,702 | $100,394 | $5,100 | $95,294 |
| 2014 | -- | $88,290 | $2,715 | $85,575 |
| 2013 | -- | $72,599 | $2,500 | $70,099 |
Source: Public Records
Map
Nearby Homes
- 3003 18th St W
- 3111 17th St W
- 2921 18th St W
- 2911 16th St W
- 2709 19th St W
- 3003 19th St W
- 3006 19th St W
- 3200 14th St W
- 3005 20th St W
- 2917 13th St W Unit 1
- 3510 9th Ct W
- 3101 12th St W
- 3210 18th St W
- 3300 15th St W
- 3304 15th St W
- 2814 18th St W
- 3206 12th St W
- 3106 11th St W
- 3301 18th St W
- 3303 W St
- 3101 17th St W
- 3019 17th St W
- 3017 16th St W Unit 1
- 3012 16th St W
- 3101 16th St W
- 3101 16th St W Unit 1
- 3015 16th St W
- 3105 16th St W
- 3106 16th St W
- 3100 17th St W
- 3011 17th St W
- 3107 16th St W
- 3008 16th St W
- 3011 16th St W Unit 2
- 3102 17th St W
- 3016 17th St W
- 3109 16th St W Unit 1
- 3012 15th St W Unit 1
- 3009 17th St W
- 3009 17th St W