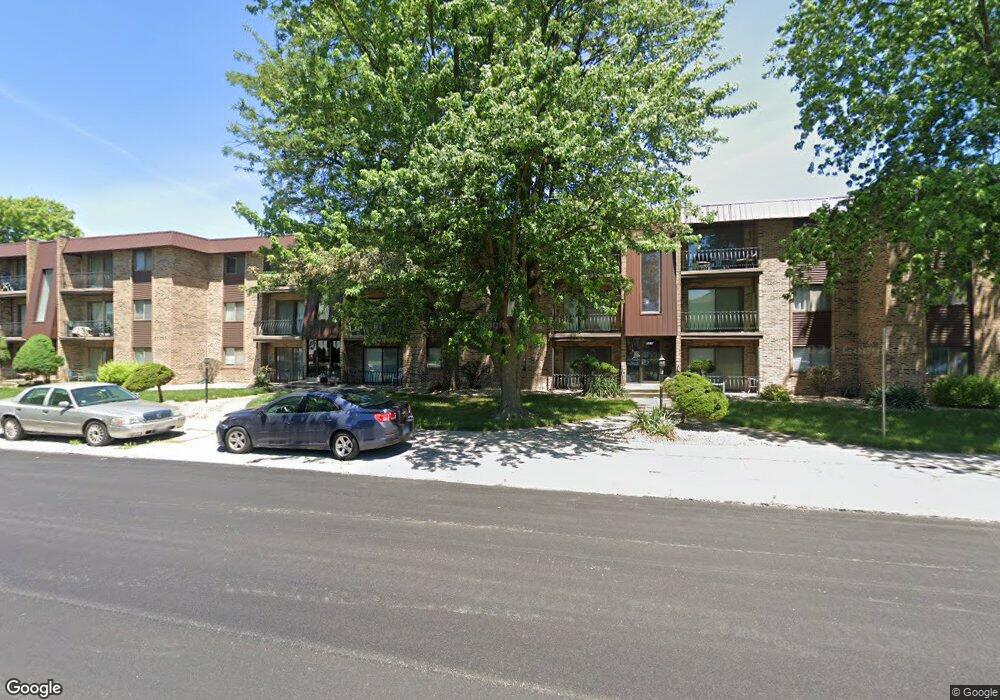
3018 Bernice Rd Unit 106 Lansing, IL 60438
Estimated Value: $74,521 - $138,000
2
Beds
1
Bath
900
Sq Ft
$108/Sq Ft
Est. Value
About This Home
This home is located at 3018 Bernice Rd Unit 106, Lansing, IL 60438 and is currently estimated at $97,130, approximately $107 per square foot. 3018 Bernice Rd Unit 106 is a home located in Cook County with nearby schools including Reavis Elementary School, Memorial Jr High School, and Thornton Fractnl So High School.
Ownership History
Date
Name
Owned For
Owner Type
Purchase Details
Closed on
Mar 28, 2022
Sold by
Woodard Dora
Bought by
3018 Bernice Rd Unit 106 Revocable Livin
Current Estimated Value
Purchase Details
Closed on
Mar 3, 2022
Sold by
Woodard Dora
Bought by
3018 Bernice Rd Unit 106 Revocable Livin
Purchase Details
Closed on
Oct 14, 1998
Sold by
Scates Violet
Bought by
Woodard Dora
Home Financials for this Owner
Home Financials are based on the most recent Mortgage that was taken out on this home.
Original Mortgage
$52,300
Interest Rate
6.68%
Mortgage Type
Purchase Money Mortgage
Purchase Details
Closed on
Jul 11, 1997
Sold by
Amazzalorso Frances and Formoso Diane
Bought by
Scates Violet and Woodard Dora
Home Financials for this Owner
Home Financials are based on the most recent Mortgage that was taken out on this home.
Original Mortgage
$37,600
Interest Rate
7.32%
Create a Home Valuation Report for This Property
The Home Valuation Report is an in-depth analysis detailing your home's value as well as a comparison with similar homes in the area
Home Values in the Area
Average Home Value in this Area
Purchase History
| Date | Buyer | Sale Price | Title Company |
|---|---|---|---|
| 3018 Bernice Rd Unit 106 Revocable Livin | -- | -- | |
| 3018 Bernice Rd Unit 106 Revocable Livin | -- | -- | |
| Woodard Dora | -- | -- | |
| Scates Violet | $47,000 | Attorneys Natl Title Network |
Source: Public Records
Mortgage History
| Date | Status | Borrower | Loan Amount |
|---|---|---|---|
| Previous Owner | Woodard Dora | $52,300 | |
| Previous Owner | Scates Violet | $37,600 |
Source: Public Records
Tax History Compared to Growth
Tax History
| Year | Tax Paid | Tax Assessment Tax Assessment Total Assessment is a certain percentage of the fair market value that is determined by local assessors to be the total taxable value of land and additions on the property. | Land | Improvement |
|---|---|---|---|---|
| 2024 | $2,916 | $6,028 | $534 | $5,494 |
| 2023 | $2,213 | $6,028 | $534 | $5,494 |
| 2022 | $2,213 | $3,407 | $468 | $2,939 |
| 2021 | $2,152 | $3,405 | $467 | $2,938 |
| 2020 | $1,998 | $3,405 | $467 | $2,938 |
| 2019 | $3,356 | $5,895 | $434 | $5,461 |
| 2018 | $3,294 | $5,895 | $434 | $5,461 |
| 2017 | $3,326 | $5,895 | $434 | $5,461 |
| 2016 | $2,911 | $5,324 | $400 | $4,924 |
| 2015 | $2,705 | $5,324 | $400 | $4,924 |
| 2014 | $3,420 | $6,825 | $400 | $6,425 |
| 2013 | $2,178 | $4,837 | $400 | $4,437 |
Source: Public Records
Map
Nearby Homes
- 3026 Bernice Rd Unit 308
- 2950 Bernice Rd
- 3425 Bernice Ave
- 17303 Chicago Ave
- 17218 Park Ave
- 17157 Chicago Ave
- 17318 Walter St
- 17256 Walter St
- 17057 Park Ave
- 17518 Roy St
- 17303 Roy St
- 17048 Lorenz Ave
- 17153 Walter St
- 17132 Walter St
- 17552 Roy St
- 17226 Community St
- 17335 Community St
- 17331 Community St
- 17641 Burnham Ave
- 17519 Community St
- 3002 Bernice Rd Unit 101
- 3018 Bernice Rd Unit 306
- 3002 Bernice Rd Unit 201
- 3018 Bernice Rd Unit 206
- 3018 Bernice Rd Unit 105
- 3002 Bernice Rd Unit 202
- 3002 Bernice Rd Unit 302
- 3002 Bernice Rd Unit 102
- 3018 Bernice Rd Unit 305
- 3002 Bernice Rd Unit 301
- 3018 Bernice Rd Unit 205
- 3010 Bernice Rd Unit 304
- 3010 Bernice Rd Unit 104
- 3010 Bernice Rd Unit 103
- 3010 Bernice Rd Unit 203
- 3010 Bernice Rd Unit 204
- 3026 Bernice Rd Unit 307
- 3026 Bernice Rd Unit 208
- 3026 Bernice Rd Unit 207
- 3026 Bernice Rd Unit 107