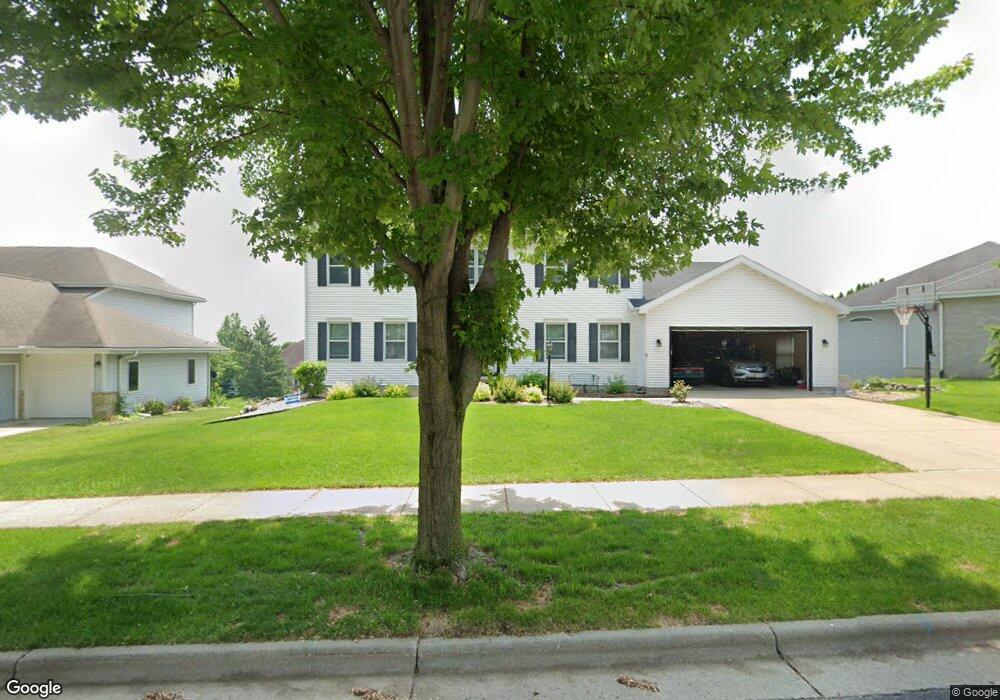
3018 Edenberry St Fitchburg, WI 53711
Estimated Value: $453,000 - $856,000
--
Bed
--
Bath
--
Sq Ft
0.27
Acres
About This Home
This home is located at 3018 Edenberry St, Fitchburg, WI 53711 and is currently estimated at $653,244. 3018 Edenberry St is a home located in Dane County with nearby schools including Leopold Elementary School, Cherokee Heights Middle School, and West High School.
Ownership History
Date
Name
Owned For
Owner Type
Purchase Details
Closed on
Feb 14, 2023
Sold by
Snelling Lisa D
Bought by
Lisa D Vella Snelling Living T Rust
Current Estimated Value
Home Financials for this Owner
Home Financials are based on the most recent Mortgage that was taken out on this home.
Original Mortgage
$226,000
Outstanding Balance
$218,909
Interest Rate
6.33%
Mortgage Type
Construction
Estimated Equity
$434,335
Purchase Details
Closed on
Feb 10, 2023
Sold by
Snelling Christopher L
Bought by
Snelling Lisa D
Home Financials for this Owner
Home Financials are based on the most recent Mortgage that was taken out on this home.
Original Mortgage
$226,000
Outstanding Balance
$218,909
Interest Rate
6.33%
Mortgage Type
Construction
Estimated Equity
$434,335
Purchase Details
Closed on
Apr 28, 2010
Sold by
Snelling Christopher L
Bought by
Snelling Christopher L and Snelling Lisa D
Home Financials for this Owner
Home Financials are based on the most recent Mortgage that was taken out on this home.
Original Mortgage
$276,000
Interest Rate
5.05%
Mortgage Type
New Conventional
Create a Home Valuation Report for This Property
The Home Valuation Report is an in-depth analysis detailing your home's value as well as a comparison with similar homes in the area
Home Values in the Area
Average Home Value in this Area
Purchase History
| Date | Buyer | Sale Price | Title Company |
|---|---|---|---|
| Lisa D Vella Snelling Living T Rust | -- | -- | |
| Snelling Lisa D | -- | -- | |
| Snelling Christopher L | -- | None Available |
Source: Public Records
Mortgage History
| Date | Status | Borrower | Loan Amount |
|---|---|---|---|
| Open | Lisa D Vella Snelling Living T Rust | $226,000 | |
| Previous Owner | Snelling Christopher L | $276,000 |
Source: Public Records
Tax History Compared to Growth
Tax History
| Year | Tax Paid | Tax Assessment Tax Assessment Total Assessment is a certain percentage of the fair market value that is determined by local assessors to be the total taxable value of land and additions on the property. | Land | Improvement |
|---|---|---|---|---|
| 2024 | $9,099 | $538,400 | $88,000 | $450,400 |
| 2023 | $8,623 | $445,800 | $88,000 | $357,800 |
| 2021 | $8,725 | $405,300 | $80,000 | $325,300 |
| 2020 | $8,439 | $405,300 | $80,000 | $325,300 |
| 2019 | $8,485 | $395,400 | $85,000 | $310,400 |
| 2018 | $8,094 | $381,000 | $85,000 | $296,000 |
| 2017 | $8,155 | $367,300 | $85,000 | $282,300 |
| 2016 | $8,435 | $366,200 | $85,000 | $281,200 |
| 2015 | $8,651 | $378,700 | $85,000 | $293,700 |
| 2014 | $8,519 | $380,100 | $85,000 | $295,100 |
| 2013 | $8,291 | $380,100 | $85,000 | $295,100 |
Source: Public Records
Map
Nearby Homes
- 2906 Brian Ln
- 5670 Ashbourne Ln
- 5586 Bantry Ln
- 5639 Brendan Ave
- 34 Arboredge Way Unit 24
- 3010 Yarmouth Unit 202
- LOT 17 Dellvue Dr
- 5527 Caddis Bend Unit 5527
- 5470 Caddis Bend Unit 102
- 5226 Inspiration Way
- 5224 Inspiration Way
- 5218 Inspiration Way
- 5206 Inspiration Way
- 5204 Inspiration Way
- 5212 Inspiration Way
- 5210 Inspiration Way
- 5208 Inspiration Way
- 2897 Glacier Valley Rd
- 5472 Coachman Place Unit 5472
- 5846 Schumann Dr
- 3022 Edenberry St
- 3008 Edenberry St
- 5690 Longford Terrace
- 3021 Edenberry St
- 5686 Longford Terrace
- 3026 Edenberry St
- 3017 Edenberry St
- 3025 Edenberry St
- 3005 Dunmore St
- 3013 Edenberry St
- 3009 Edenberry St
- 3029 Edenberry St
- 2988 Edenberry St
- 3005 Edenberry St
- 2989 Carlingford Ln
- 3001 Dunmore St
- 5721 Summerhill Ct
- 3001 Edenberry St
- 5717 Summerhill Ct
- 5725 Summerhill Ct