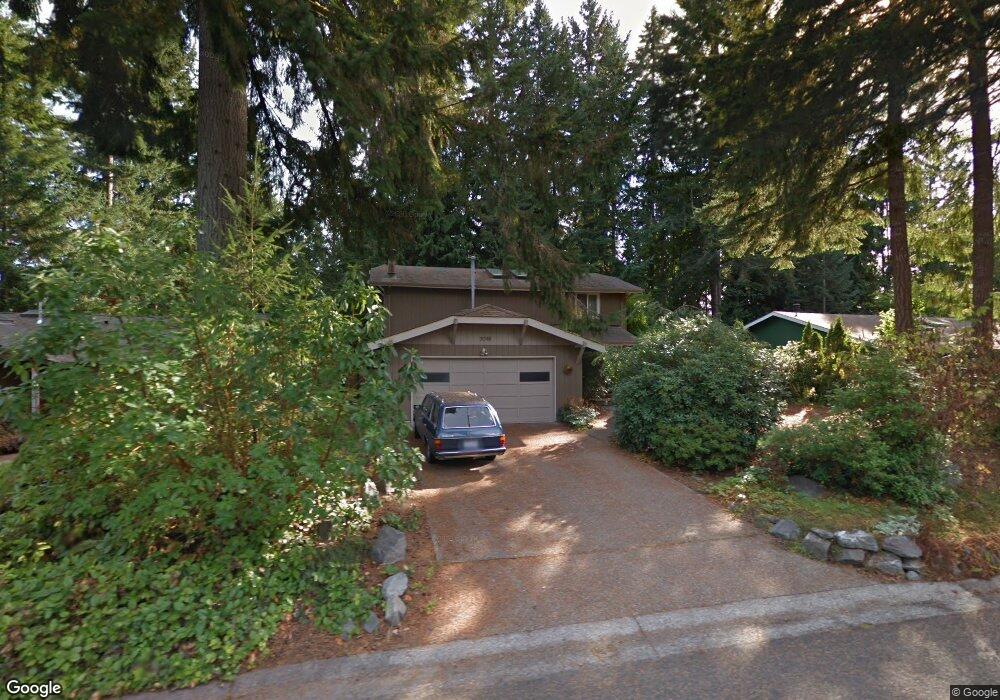
3018 Langridge Loop NW Olympia, WA 98502
Estimated Value: $538,327 - $592,000
4
Beds
3
Baths
1,944
Sq Ft
$292/Sq Ft
Est. Value
About This Home
This home is located at 3018 Langridge Loop NW, Olympia, WA 98502 and is currently estimated at $568,332, approximately $292 per square foot. 3018 Langridge Loop NW is a home located in Thurston County with nearby schools including Garfield Elementary School, Jefferson Middle School, and Capital High School.
Ownership History
Date
Name
Owned For
Owner Type
Purchase Details
Closed on
Jun 6, 2005
Sold by
Capell Lee J and Capell Alice M
Bought by
Ryser Rudolph C and Korn Leslie Ellen
Current Estimated Value
Home Financials for this Owner
Home Financials are based on the most recent Mortgage that was taken out on this home.
Original Mortgage
$195,600
Interest Rate
5.72%
Mortgage Type
Stand Alone First
Purchase Details
Closed on
Aug 22, 1997
Sold by
Ramey Karen L and Ramey Donald K
Bought by
Capell Lee J and Capell Alice M
Home Financials for this Owner
Home Financials are based on the most recent Mortgage that was taken out on this home.
Original Mortgage
$154,230
Interest Rate
7.43%
Create a Home Valuation Report for This Property
The Home Valuation Report is an in-depth analysis detailing your home's value as well as a comparison with similar homes in the area
Home Values in the Area
Average Home Value in this Area
Purchase History
| Date | Buyer | Sale Price | Title Company |
|---|---|---|---|
| Ryser Rudolph C | $244,500 | Thurston County Title | |
| Capell Lee J | $159,000 | Transnation Title Insurance |
Source: Public Records
Mortgage History
| Date | Status | Borrower | Loan Amount |
|---|---|---|---|
| Previous Owner | Ryser Rudolph C | $195,600 | |
| Previous Owner | Capell Lee J | $154,230 |
Source: Public Records
Tax History Compared to Growth
Tax History
| Year | Tax Paid | Tax Assessment Tax Assessment Total Assessment is a certain percentage of the fair market value that is determined by local assessors to be the total taxable value of land and additions on the property. | Land | Improvement |
|---|---|---|---|---|
| 2024 | $4,715 | $468,800 | $167,000 | $301,800 |
| 2023 | $4,715 | $450,700 | $140,700 | $310,000 |
| 2022 | $4,338 | $445,200 | $110,200 | $335,000 |
| 2021 | $4,043 | $362,900 | $94,500 | $268,400 |
| 2020 | $3,861 | $313,000 | $98,500 | $214,500 |
| 2019 | $3,297 | $291,600 | $57,400 | $234,200 |
| 2018 | $3,358 | $249,200 | $54,800 | $194,400 |
| 2017 | $2,857 | $228,450 | $56,250 | $172,200 |
| 2016 | $2,635 | $216,300 | $61,400 | $154,900 |
| 2014 | -- | $210,500 | $61,400 | $149,100 |
Source: Public Records
Map
Nearby Homes
- 1201 Tabitha Ct NW
- 2619 Walnut Loop NW
- 812 Dundee Rd NW
- 1807 Marigold St NW
- 2510 17th Ave NW
- 1822 Jonquil Ln NW
- 2608 19th Way NW
- 1910 Bowman Ave NW
- 1203 Bowman Ave NW
- 2023 Bush Ave NW
- 3218 6th Ave NW
- 2005 E End St NW
- 415 Yauger Way NW
- 420 Bungalow Dr NW
- 1731 Brawne Ave NW Unit B
- 2201 Sophie Way NW
- 236 Milroy St NW
- 317 Nine Bark St NW
- 3526 6th Ave NW
- 2304 Cooper Crest Place NW
- 3022 Langridge Loop NW
- 3014 Langridge Loop NW
- 2724 Langridge Loop NW
- 3026 Langridge Loop NW
- 2728 Langridge Loop NW
- 3010 Langridge Loop NW
- 2720 Langridge Loop NW
- 3019 Langridge Loop NW
- 3023 Langridge Loop NW
- 3015 Langridge Loop NW
- 2714 Langridge Loop NW
- 3040 Langridge Loop NW
- 3011 Langridge Loop NW
- 3004 Langridge Loop NW
- 3027 Langridge Loop NW
- 2736 Langridge Loop NW
- 2706 Langridge Loop NW
- 3007 Langridge Loop NW
- 2725 Langridge Loop NW
- 3031 Langridge Loop NW