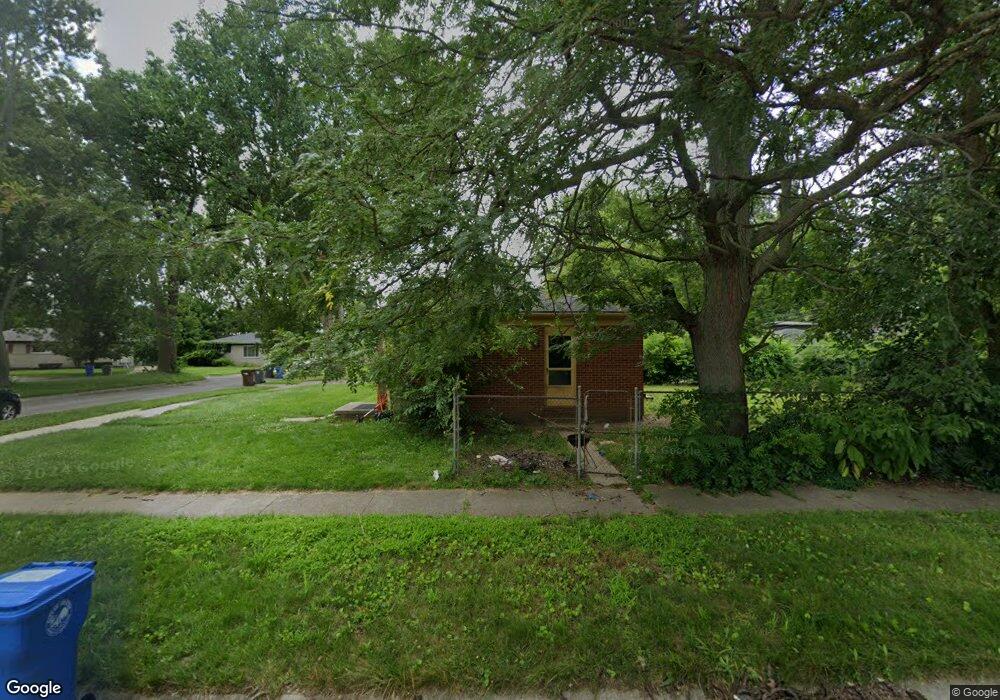
30183 Andover Ct Inkster, MI 48141
Estimated Value: $107,000 - $157,000
--
Bed
1
Bath
1,054
Sq Ft
$124/Sq Ft
Est. Value
About This Home
This home is located at 30183 Andover Ct, Inkster, MI 48141 and is currently estimated at $130,205, approximately $123 per square foot. 30183 Andover Ct is a home located in Wayne County with nearby schools including Romulus Elementary School, Romulus Middle School, and Romulus Senior High School.
Ownership History
Date
Name
Owned For
Owner Type
Purchase Details
Closed on
Dec 18, 2020
Sold by
Raymond Buttigieg
Bought by
Acad Investments Llc
Current Estimated Value
Purchase Details
Closed on
Nov 15, 2005
Sold by
U S Bank Na
Bought by
Buttigieg Raymond
Purchase Details
Closed on
Oct 31, 2005
Sold by
First Nlc Financial Services Llc
Bought by
U S Bank Na and Csfb Abs Trust Series Heat 2002-4
Purchase Details
Closed on
Jun 5, 2005
Sold by
First Nlc Financial Services Llc
Bought by
Us Bank Na and Csfb Abs Trust Series Heat 2002-4
Purchase Details
Closed on
Sep 15, 2004
Sold by
Tyson Kimberly
Bought by
First Nlc Financial Services Llc
Purchase Details
Closed on
Feb 28, 2001
Sold by
Grant Annie B
Bought by
Tyson Kimberly
Purchase Details
Closed on
Feb 7, 2001
Sold by
Grant Annie B
Bought by
Countrywide Home Loans Inc
Purchase Details
Closed on
Sep 22, 1999
Sold by
Grant Annie B
Bought by
Contimortgage Corp
Create a Home Valuation Report for This Property
The Home Valuation Report is an in-depth analysis detailing your home's value as well as a comparison with similar homes in the area
Home Values in the Area
Average Home Value in this Area
Purchase History
| Date | Buyer | Sale Price | Title Company |
|---|---|---|---|
| Acad Investments Llc | $33,000 | Title One Inc | |
| Buttigieg Raymond | $49,000 | None Available | |
| U S Bank Na | -- | Attorneys Title Agency Llc | |
| Us Bank Na | -- | -- | |
| First Nlc Financial Services Llc | $60,268 | -- | |
| Tyson Kimberly | $67,950 | -- | |
| Countrywide Home Loans Inc | $47,049 | -- | |
| Contimortgage Corp | $22,388 | -- |
Source: Public Records
Tax History Compared to Growth
Tax History
| Year | Tax Paid | Tax Assessment Tax Assessment Total Assessment is a certain percentage of the fair market value that is determined by local assessors to be the total taxable value of land and additions on the property. | Land | Improvement |
|---|---|---|---|---|
| 2025 | $2,614 | $58,400 | $0 | $0 |
| 2024 | $2,614 | $43,400 | $0 | $0 |
| 2023 | $1,970 | $34,700 | $0 | $0 |
| 2022 | $2,498 | $28,700 | $0 | $0 |
| 2021 | $2,593 | $25,700 | $0 | $0 |
| 2020 | $1,638 | $22,600 | $0 | $0 |
| 2019 | $1,635 | $19,300 | $0 | $0 |
| 2018 | $1,146 | $16,800 | $0 | $0 |
| 2017 | $975 | $16,400 | $0 | $0 |
| 2016 | $1,852 | $14,800 | $0 | $0 |
| 2015 | $1,810 | $18,100 | $0 | $0 |
| 2013 | $2,540 | $25,400 | $0 | $0 |
| 2012 | $2,376 | $28,800 | $3,400 | $25,400 |
Source: Public Records
Map
Nearby Homes
- 29978 Carlysle St
- 29600 Pine St
- Vacant Wayland Ct
- 4770 Matthew St
- 4705 S Middlebelt Rd
- 29119 York St
- 29038 York St
- 29026 York St
- 5022 S Middlebelt Rd
- 4971 Julius Blvd
- 29114 Richard St
- 28870 Annapolis Ave Unit 16
- 29006 Eton St
- 5320 S Middlebelt Rd
- 29635 Julius Blvd
- 3616 Spring Hill Ave
- 4080 Isabelle St
- 3819 Garfield St
- 3512 Barry St
- 29870 Lacy Dr Unit 132
- 30171 Andover Ct
- 30159 Andover Ct
- 261 Elm Path Dr
- 30147 Andover Ct
- 30111 Andover Ct
- 30123 Andover Ct
- 3988 Lovett Ave
- 30135 Andover Ct
- 3976 Lovett Ave
- 4004 Lovett Ct
- 3964 Lovett Ave
- 4010 Lovett Ct
- 3952 Lovett Ave
- 3940 Lovett Ave
- 3983 Lovett Ave
- 4020 Lovett Ct
- 3971 Lovett Ave
- 4025 Lovett Ct
- 3928 Lovett Ave
- 3959 Lovett Ave