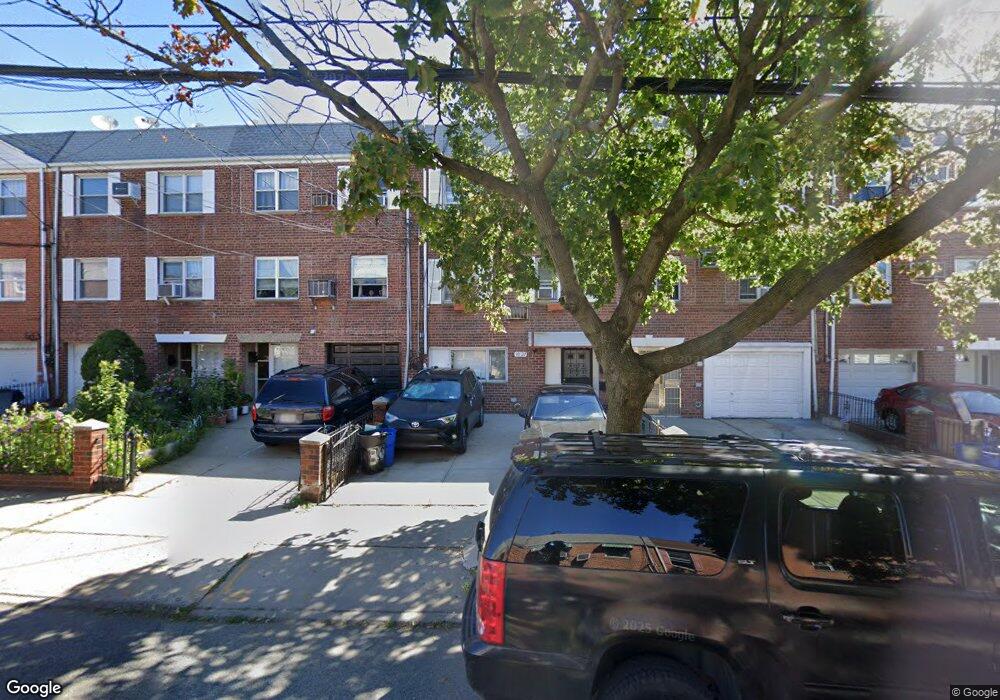
3019 71st St East Elmhurst, NY 11370
Jackson Heights NeighborhoodEstimated Value: $1,293,000 - $1,531,689
--
Bed
--
Bath
2,422
Sq Ft
$576/Sq Ft
Est. Value
About This Home
This home is located at 3019 71st St, East Elmhurst, NY 11370 and is currently estimated at $1,396,172, approximately $576 per square foot. 3019 71st St is a home located in Queens County with nearby schools including Ps 152 Gwendolyn N Alleyne School, I.S. 230, and William Cullen Bryant High School.
Ownership History
Date
Name
Owned For
Owner Type
Purchase Details
Closed on
Dec 15, 2004
Sold by
Mosquera Hugo F
Bought by
Cruz Juan
Current Estimated Value
Home Financials for this Owner
Home Financials are based on the most recent Mortgage that was taken out on this home.
Original Mortgage
$114,750
Outstanding Balance
$57,859
Interest Rate
5.73%
Estimated Equity
$1,338,313
Purchase Details
Closed on
Sep 29, 2004
Sold by
Pedote Francesco and Pedote Marion
Bought by
Mosquera Hugo F
Home Financials for this Owner
Home Financials are based on the most recent Mortgage that was taken out on this home.
Original Mortgage
$522,000
Interest Rate
5.8%
Mortgage Type
Purchase Money Mortgage
Create a Home Valuation Report for This Property
The Home Valuation Report is an in-depth analysis detailing your home's value as well as a comparison with similar homes in the area
Home Values in the Area
Average Home Value in this Area
Purchase History
| Date | Buyer | Sale Price | Title Company |
|---|---|---|---|
| Cruz Juan | $765,000 | -- | |
| Cruz Juan | $765,000 | -- | |
| Mosquera Hugo F | $580,000 | -- | |
| Mosquera Hugo F | $580,000 | -- |
Source: Public Records
Mortgage History
| Date | Status | Borrower | Loan Amount |
|---|---|---|---|
| Open | Cruz Juan | $114,750 | |
| Closed | Cruz Juan | $114,750 | |
| Open | Cruz Juan | $612,000 | |
| Closed | Cruz Juan | $612,000 | |
| Previous Owner | Mosquera Hugo F | $522,000 |
Source: Public Records
Tax History Compared to Growth
Tax History
| Year | Tax Paid | Tax Assessment Tax Assessment Total Assessment is a certain percentage of the fair market value that is determined by local assessors to be the total taxable value of land and additions on the property. | Land | Improvement |
|---|---|---|---|---|
| 2025 | $11,400 | $60,162 | $8,312 | $51,850 |
| 2024 | $11,400 | $56,759 | $8,910 | $47,849 |
| 2023 | $10,755 | $53,546 | $8,158 | $45,388 |
| 2022 | $10,531 | $62,220 | $10,860 | $51,360 |
| 2021 | $11,101 | $61,800 | $10,860 | $50,940 |
| 2020 | $10,612 | $64,620 | $10,860 | $53,760 |
| 2019 | $9,895 | $64,620 | $10,860 | $53,760 |
| 2018 | $9,096 | $44,622 | $8,093 | $36,529 |
| 2017 | $8,961 | $43,959 | $8,464 | $35,495 |
| 2016 | $8,788 | $43,959 | $8,464 | $35,495 |
| 2015 | $5,002 | $41,779 | $10,822 | $30,957 |
| 2014 | $5,002 | $39,416 | $10,209 | $29,207 |
Source: Public Records
Map
Nearby Homes