Estimated Value: $401,409 - $435,000
4
Beds
2
Baths
2,153
Sq Ft
$194/Sq Ft
Est. Value
About This Home
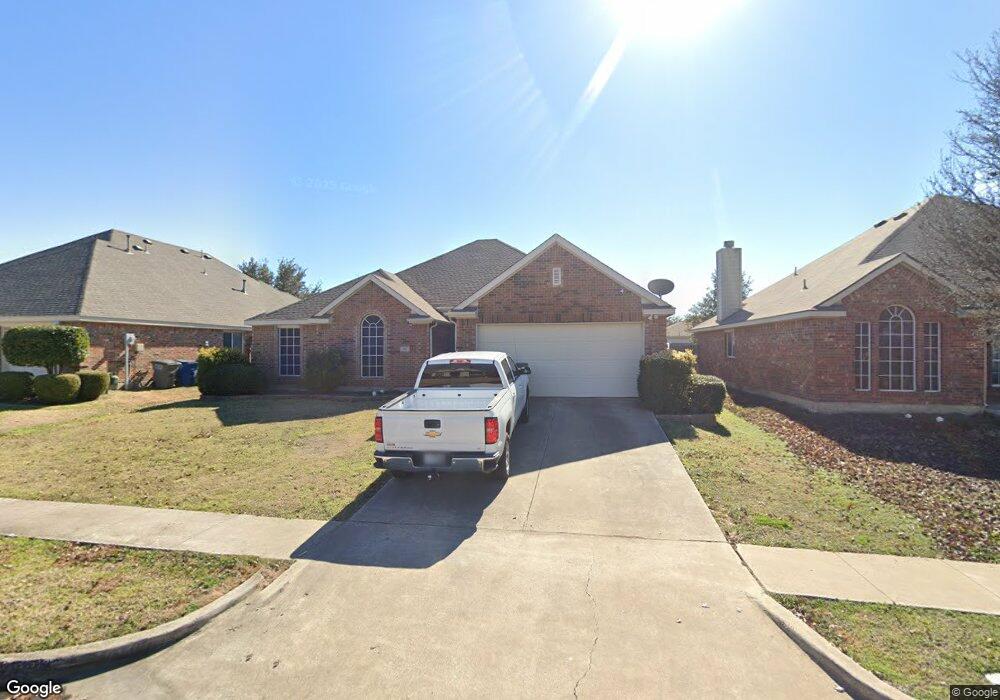
This home is located at 3019 Claybrook Dr, Wylie, TX 75098 and is currently estimated at $417,102, approximately $193 per square foot. 3019 Claybrook Dr is a home located in Collin County with nearby schools including R V Groves Elementary School, Dr. Al Draper Intermediate Middle School, and Raymond B Cooper J High School.
Ownership History
Date
Name
Owned For
Owner Type
Purchase Details
Closed on
Feb 13, 2017
Sold by
Stevens Lisa Marie and Eckman Lisa Marie
Bought by
Eckman Lisa Marie
Current Estimated Value
Home Financials for this Owner
Home Financials are based on the most recent Mortgage that was taken out on this home.
Original Mortgage
$161,000
Outstanding Balance
$133,002
Interest Rate
4.12%
Mortgage Type
Stand Alone First
Estimated Equity
$284,100
Purchase Details
Closed on
Oct 15, 2004
Sold by
Goodman Family Of Builders Lp
Bought by
Eckman Shaun Michael and Stevens Lisa Marie
Home Financials for this Owner
Home Financials are based on the most recent Mortgage that was taken out on this home.
Original Mortgage
$126,400
Interest Rate
5.82%
Mortgage Type
Purchase Money Mortgage
Create a Home Valuation Report for This Property
The Home Valuation Report is an in-depth analysis detailing your home's value as well as a comparison with similar homes in the area
Home Values in the Area
Average Home Value in this Area
Purchase History
| Date | Buyer | Sale Price | Title Company |
|---|---|---|---|
| Eckman Lisa Marie | -- | Superior Abstract | |
| Eckman Shaun Michael | -- | Flt |
Source: Public Records
Mortgage History
| Date | Status | Borrower | Loan Amount |
|---|---|---|---|
| Open | Eckman Lisa Marie | $161,000 | |
| Previous Owner | Eckman Shaun Michael | $126,400 | |
| Closed | Eckman Shaun Michael | $31,600 |
Source: Public Records
Tax History Compared to Growth
Tax History
| Year | Tax Paid | Tax Assessment Tax Assessment Total Assessment is a certain percentage of the fair market value that is determined by local assessors to be the total taxable value of land and additions on the property. | Land | Improvement |
|---|---|---|---|---|
| 2025 | $8,204 | $416,465 | $125,000 | $291,465 |
| 2024 | $8,204 | $415,370 | $125,000 | $290,370 |
| 2023 | $8,204 | $409,146 | $110,000 | $299,146 |
| 2022 | $7,678 | $349,973 | $90,000 | $259,973 |
| 2021 | $6,934 | $294,704 | $70,000 | $224,704 |
| 2020 | $6,924 | $278,836 | $65,000 | $213,836 |
| 2019 | $7,251 | $275,947 | $65,000 | $210,947 |
| 2018 | $7,124 | $264,517 | $65,000 | $199,518 |
| 2017 | $6,476 | $252,344 | $60,000 | $192,344 |
| 2016 | $6,074 | $226,800 | $50,000 | $176,800 |
| 2015 | $4,951 | $198,735 | $40,000 | $158,735 |
Source: Public Records
Map
Nearby Homes
- 3014 Eastwood Dr
- 3119 Connor Ln
- 3105 Admiral Dr
- 310 Admiral Dr
- 307 Wooded Creek Ave
- 2912 Katie Cir
- 3111 Candlebrook Dr
- 2907 Abby Ln
- 3003 Candlebrook Dr
- 3017 Eagle Mountain Dr
- 802 Appalachian Dr
- 3103 Creekwood Dr
- Iris Plan at Wooded Creek
- Beckett II Plan at Wooded Creek
- Annabelle III Plan at Wooded Creek
- 3006 Springwell Pkwy
- 2615 Gum Tree Trail
- 517 Royal Oak Dr
- 413 Royal Oak Dr
- 1205 Periwinkle Dr
- 3017 Claybrook Dr
- 3101 Claybrook Dr
- 3018 Connor Ln
- 3015 Claybrook Dr
- 3103 Claybrook Dr
- 3100 Connor Ln
- 3016 Connor Ln
- 3102 Connor Ln
- 3018 Claybrook Dr
- 3020 Claybrook Dr
- 3013 Claybrook Dr
- 3014 Connor Ln
- 3016 Claybrook Dr
- 3105 Claybrook Dr
- 3100 Claybrook Dr
- 3104 Connor Ln
- 3014 Claybrook Dr
- 3012 Connor Ln
- 3102 Claybrook Dr
- 3107 Claybrook Dr