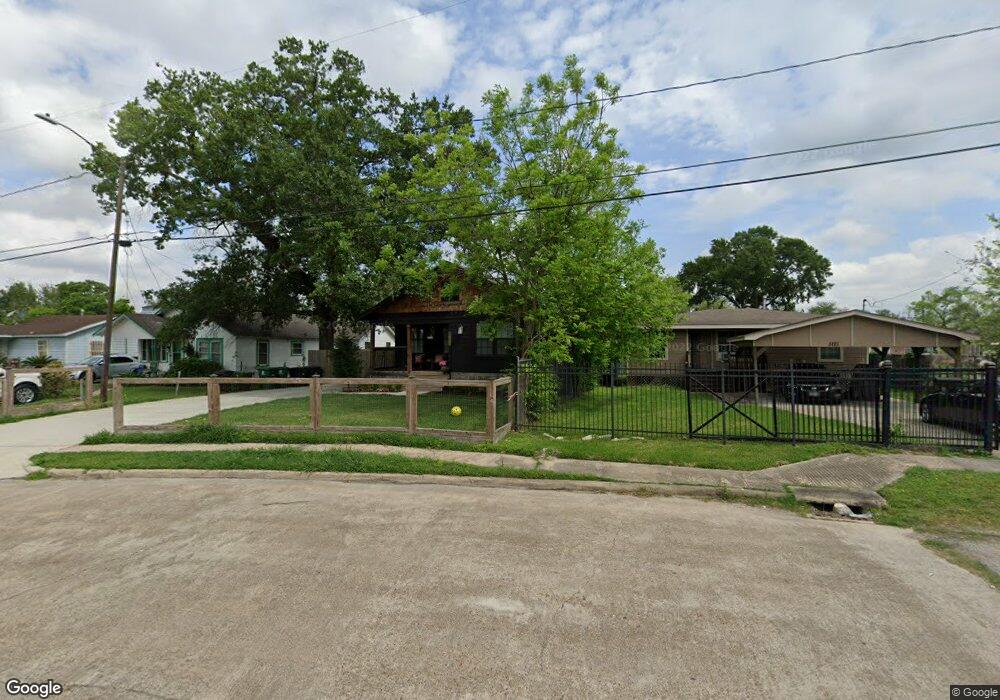
3019 Coal St Houston, TX 77026
Kashmere Gardens NeighborhoodEstimated Value: $186,858 - $250,000
3
Beds
2
Baths
1,288
Sq Ft
$163/Sq Ft
Est. Value
About This Home
This home is located at 3019 Coal St, Houston, TX 77026 and is currently estimated at $209,465, approximately $162 per square foot. 3019 Coal St is a home located in Harris County with nearby schools including Ross Elementary School, Key Middle, and Kashmere High School.
Ownership History
Date
Name
Owned For
Owner Type
Purchase Details
Closed on
Sep 16, 2022
Sold by
Broussard Jonathan J and Paige Allison
Bought by
Cornell Veronica
Current Estimated Value
Home Financials for this Owner
Home Financials are based on the most recent Mortgage that was taken out on this home.
Original Mortgage
$220,924
Outstanding Balance
$210,619
Interest Rate
4.99%
Mortgage Type
FHA
Estimated Equity
-$1,154
Purchase Details
Closed on
Apr 16, 2020
Sold by
Williams Allison P
Bought by
Broussard Jonathan J
Purchase Details
Closed on
Jul 21, 2016
Sold by
Re Mart Investment
Bought by
Williams Allison P
Purchase Details
Closed on
Jun 3, 2014
Sold by
Perry Joe
Bought by
Re Mart Investment
Purchase Details
Closed on
Sep 7, 2010
Sold by
Perry Joe and Perry Carnis Urma Lee
Bought by
County Of Harris and City Of Houston
Create a Home Valuation Report for This Property
The Home Valuation Report is an in-depth analysis detailing your home's value as well as a comparison with similar homes in the area
Home Values in the Area
Average Home Value in this Area
Purchase History
| Date | Buyer | Sale Price | Title Company |
|---|---|---|---|
| Cornell Veronica | -- | Capital Title | |
| Broussard Jonathan J | -- | Ptc | |
| Williams Allison P | -- | Startex Title Co | |
| Re Mart Investment | $6,000 | None Available | |
| County Of Harris | -- | None Available |
Source: Public Records
Mortgage History
| Date | Status | Borrower | Loan Amount |
|---|---|---|---|
| Open | Cornell Veronica | $220,924 | |
| Closed | Cornell Veronica | $6,628 |
Source: Public Records
Tax History Compared to Growth
Tax History
| Year | Tax Paid | Tax Assessment Tax Assessment Total Assessment is a certain percentage of the fair market value that is determined by local assessors to be the total taxable value of land and additions on the property. | Land | Improvement |
|---|---|---|---|---|
| 2025 | $1,937 | $134,575 | $65,205 | $69,370 |
| 2024 | $1,937 | $167,329 | $56,700 | $110,629 |
| 2023 | $1,937 | $157,407 | $46,778 | $110,629 |
| 2022 | $3,075 | $139,648 | $31,185 | $108,463 |
| 2021 | $2,869 | $123,095 | $31,185 | $91,910 |
| 2020 | $2,981 | $123,095 | $31,185 | $91,910 |
| 2019 | $3,081 | $121,763 | $21,263 | $100,500 |
| 2018 | $359 | $14,175 | $14,175 | $0 |
| 2017 | $358 | $14,175 | $14,175 | $0 |
| 2016 | $287 | $11,340 | $11,340 | $0 |
| 2015 | -- | $11,340 | $11,340 | $0 |
| 2014 | -- | $11,350 | $11,350 | $0 |
Source: Public Records
Map
Nearby Homes
- 3114 Cavalcade St Unit 2
- 3110 Memel St
- 3317 Cavalcade St
- 3310 Cavalcade St
- 3313 Cavalcade St
- 4501 Cavalcade St
- 3418 Memel St
- 0 Memel St
- 4215 East Ln
- 0 Cordon St
- 4611 W Hunting St
- 3606 Chickering St
- 3414 Le Badie St
- 3102 Christie St
- 3540 Des Chaumes St
- 2915 Crane St Unit A-B
- 2917 Crane St Unit C-D
- 3413 Hardie St
- 3717 Sayers St
- 4108 Falls St