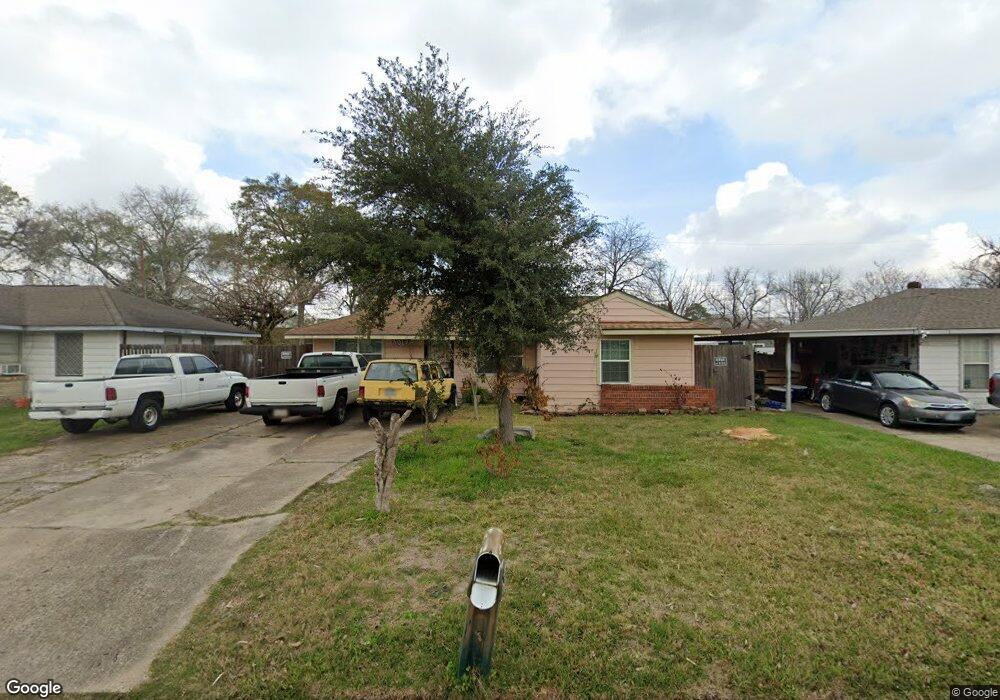
3019 Cricket Ln Houston, TX 77093
Eastex-Jensen NeighborhoodEstimated Value: $157,564 - $172,000
3
Beds
1
Bath
1,173
Sq Ft
$141/Sq Ft
Est. Value
About This Home
This home is located at 3019 Cricket Ln, Houston, TX 77093 and is currently estimated at $165,891, approximately $141 per square foot. 3019 Cricket Ln is a home located in Harris County with nearby schools including Scarborough Elementary School, Patrick Henry Middle School, and Sam Houston Math, Science & Technology Center.
Ownership History
Date
Name
Owned For
Owner Type
Purchase Details
Closed on
Aug 31, 2020
Sold by
Mora Ruby and Mora Martin G
Bought by
Mora Ofelia Sanchez
Current Estimated Value
Purchase Details
Closed on
Jul 7, 2000
Sold by
Centex Home Equity Corp
Bought by
Mora Flores Martin and Mora Flores Ofelia
Home Financials for this Owner
Home Financials are based on the most recent Mortgage that was taken out on this home.
Original Mortgage
$45,000
Outstanding Balance
$16,479
Interest Rate
8.56%
Estimated Equity
$149,412
Purchase Details
Closed on
Feb 1, 2000
Sold by
Marquez Alfredo and Jimenez Maria
Bought by
Centex Home Equity Corp
Purchase Details
Closed on
Jun 1, 1998
Sold by
Harcrow Gerald and Harcrow Georgia
Bought by
Marquez Alfredo and Jimenez Maria
Home Financials for this Owner
Home Financials are based on the most recent Mortgage that was taken out on this home.
Original Mortgage
$40,155
Interest Rate
7.27%
Create a Home Valuation Report for This Property
The Home Valuation Report is an in-depth analysis detailing your home's value as well as a comparison with similar homes in the area
Home Values in the Area
Average Home Value in this Area
Purchase History
| Date | Buyer | Sale Price | Title Company |
|---|---|---|---|
| Mora Ofelia Sanchez | -- | None Available | |
| Mora Flores Martin | -- | American Title Co | |
| Centex Home Equity Corp | $37,400 | -- | |
| Marquez Alfredo | -- | Texas American Title Company |
Source: Public Records
Mortgage History
| Date | Status | Borrower | Loan Amount |
|---|---|---|---|
| Open | Mora Flores Martin | $45,000 | |
| Previous Owner | Marquez Alfredo | $40,155 | |
| Closed | Marquez Alfredo | $2,500 |
Source: Public Records
Tax History Compared to Growth
Tax History
| Year | Tax Paid | Tax Assessment Tax Assessment Total Assessment is a certain percentage of the fair market value that is determined by local assessors to be the total taxable value of land and additions on the property. | Land | Improvement |
|---|---|---|---|---|
| 2025 | $881 | $141,242 | $54,600 | $86,642 |
| 2024 | $881 | $133,602 | $45,000 | $88,602 |
| 2023 | $881 | $132,264 | $45,000 | $87,264 |
| 2022 | $1,917 | $118,515 | $30,000 | $88,515 |
| 2021 | $1,845 | $90,823 | $19,500 | $71,323 |
| 2020 | $1,742 | $86,184 | $19,500 | $66,684 |
| 2019 | $1,655 | $82,264 | $16,500 | $65,764 |
| 2018 | $908 | $59,461 | $16,500 | $42,961 |
| 2017 | $1,504 | $59,461 | $16,500 | $42,961 |
| 2016 | $1,381 | $54,598 | $16,500 | $38,098 |
| 2015 | $1,025 | $54,598 | $16,500 | $38,098 |
| 2014 | $1,025 | $58,248 | $16,500 | $41,748 |
Source: Public Records
Map
Nearby Homes
- 1904 Little York Rd
- 1728 Little York Rd
- 2636 Lone Oak Rd
- 2629 Kowis St
- 2817 Cromwell St
- 3418 Hopper Rd
- 3804 Cedar Hill Ln
- 4918 Langley Rd
- 3214 Brea Crest St
- 2915 Brea Crest St
- 4410 Shelton Rd
- 2315 Langley Rd
- 2311 Warwick Rd
- 3111 Hartwick Rd
- 2237 Cromwell St
- 4415 Mooney Rd
- 2332 Margaret St
- 2152 William Tell St
- 2415 Goodloe St
- 11716 Innsbury Dr
- 3015 Cricket Ln
- 3023 Cricket Ln
- 3024 Charter Oaks Dr
- 3028 Charter Oaks Dr
- 3011 Cricket Ln
- 3027 Cricket Ln
- 3020 Charter Oaks Dr
- 3032 Charter Oaks Dr
- 3012 Cricket Ln
- 3016 Cricket Ln
- 3016 Charter Oaks Dr
- 3008 Cricket Ln
- 3031 Cricket Ln
- 3007 Cricket Ln
- 3036 Charter Oaks Dr
- 3020 Cricket Ln
- 3004 Cricket Ln
- 3012 Charter Oaks Dr
- 3035 Cricket Ln
- 3024 Cricket Ln