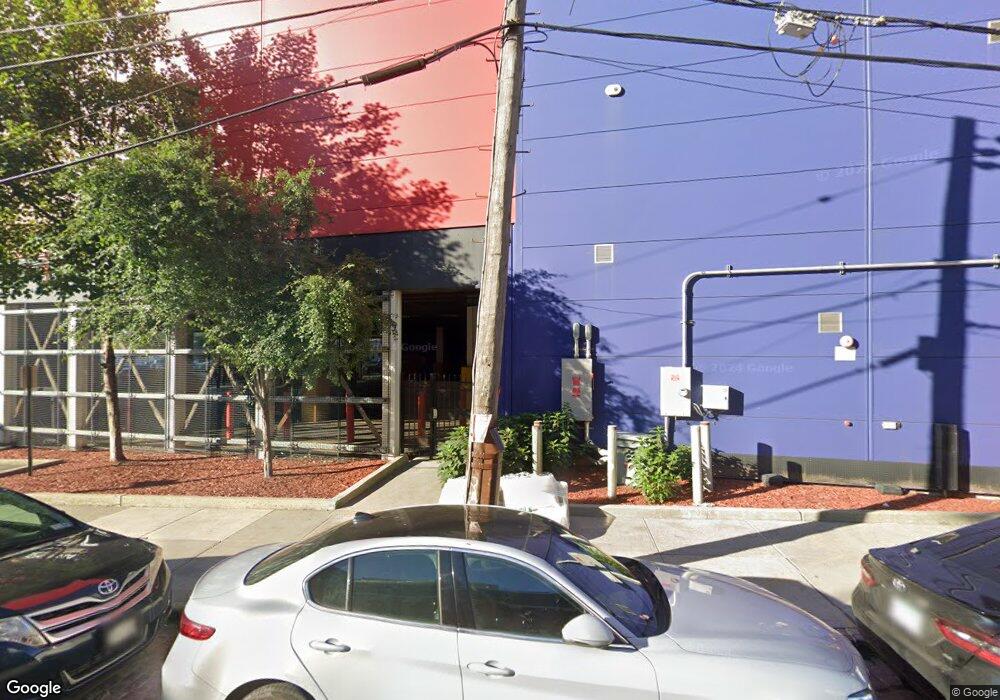
3019 Northern Blvd Long Island City, NY 11101
Long Island City NeighborhoodEstimated Value: $58,871,100
--
Bed
--
Bath
109,499
Sq Ft
$538/Sq Ft
Est. Value
About This Home
This home is located at 3019 Northern Blvd, Long Island City, NY 11101 and is currently estimated at $58,871,100, approximately $537 per square foot. 3019 Northern Blvd is a home located in Queens County with nearby schools including P.S./I.S. 78Q Early Childhood Center, I.S. 204 Oliver W. Holmes, and Long Island City High School.
Ownership History
Date
Name
Owned For
Owner Type
Purchase Details
Closed on
Dec 2, 2014
Sold by
30-19 Northern Llc and Storage Deluxe
Bought by
Cubesmart L P
Current Estimated Value
Purchase Details
Closed on
Nov 9, 2012
Sold by
30-19 Northern Llc
Bought by
30-19 Northern Llc
Home Financials for this Owner
Home Financials are based on the most recent Mortgage that was taken out on this home.
Original Mortgage
$8,150,000
Interest Rate
3.42%
Mortgage Type
Commercial
Purchase Details
Closed on
Oct 18, 2012
Sold by
Toal Margaret and % Terry J Total
Bought by
30-19 Northern Llc
Home Financials for this Owner
Home Financials are based on the most recent Mortgage that was taken out on this home.
Original Mortgage
$8,150,000
Interest Rate
3.42%
Mortgage Type
Commercial
Purchase Details
Closed on
Jun 26, 2012
Sold by
Toal Margaret and Toal Terry J
Bought by
30-19 Northern Llc
Home Financials for this Owner
Home Financials are based on the most recent Mortgage that was taken out on this home.
Original Mortgage
$4,000,000
Interest Rate
3.76%
Mortgage Type
Commercial
Create a Home Valuation Report for This Property
The Home Valuation Report is an in-depth analysis detailing your home's value as well as a comparison with similar homes in the area
Home Values in the Area
Average Home Value in this Area
Purchase History
| Date | Buyer | Sale Price | Title Company |
|---|---|---|---|
| Cubesmart L P | $38,000,000 | -- | |
| Cubesmart L P | $38,000,000 | -- | |
| 30-19 Northern Llc | -- | -- | |
| 30-19 Northern Llc | -- | -- | |
| 30-19 Northern Llc | -- | -- | |
| 30-19 Northern Llc | -- | -- | |
| 30-19 Northern Llc | $5,750,000 | -- | |
| 30-19 Northern Llc | $5,750,000 | -- |
Source: Public Records
Mortgage History
| Date | Status | Borrower | Loan Amount |
|---|---|---|---|
| Previous Owner | 30-19 Northern Llc | $8,150,000 | |
| Previous Owner | 30-19 Northern Llc | $4,000,000 |
Source: Public Records
Tax History Compared to Growth
Tax History
| Year | Tax Paid | Tax Assessment Tax Assessment Total Assessment is a certain percentage of the fair market value that is determined by local assessors to be the total taxable value of land and additions on the property. | Land | Improvement |
|---|---|---|---|---|
| 2025 | $799,964 | $7,123,950 | $983,250 | $6,140,700 |
| 2024 | $800,526 | $7,552,530 | $983,250 | $6,569,280 |
| 2023 | $800,526 | $7,557,840 | $983,250 | $6,574,590 |
| 2022 | $388,632 | $7,227,000 | $983,250 | $6,243,750 |
| 2021 | $743,275 | $7,076,250 | $983,250 | $6,093,000 |
| 2020 | $256,141 | $7,929,900 | $983,250 | $6,946,650 |
| 2019 | $221,007 | $7,904,700 | $983,250 | $6,921,450 |
| 2018 | $731,414 | $6,956,569 | $879,229 | $6,077,340 |
| 2017 | $690,263 | $6,565,182 | $775,212 | $5,789,970 |
| 2016 | $661,542 | $6,565,182 | $775,212 | $5,789,970 |
| 2015 | $25,058 | $5,936,896 | $576,946 | $5,359,950 |
| 2014 | $25,058 | $476,632 | $476,632 | $0 |
Source: Public Records
Map
Nearby Homes
- 29-18 41st Ave Unit 10-A
- 29-18 41st Ave Unit 16-B
- 29-18 41st Ave Unit 2-D
- 27-09 40th Ave Unit 5A
- 27-09 40th Ave Unit 2 C
- 27-09 40th Ave Unit 3 B
- 27-09 40th Ave Unit 6F
- 27-09 40th Ave Unit 3 A
- 3818 31st St
- 40-21 27th St Unit 6A
- 40-21 27th St Unit 6C
- 40-21 27th St Unit 5A
- 40-21 27th St Unit 4A
- 40-21 27th St Unit 3B
- 40-21 27th St Unit 3A
- 38-12 31st St
- 40-37 27th St
- 27-16 41st Ave Unit 3D
- 2705 41st Ave Unit 5D
- 40-39 27th St
- 3007 Northern Blvd
- 2310-2R 40th Ave
- 3001 Northern Blvd
- 30-01 Northern Blvd
- 3017 40th Ave
- 2924 40th Ave
- 2927 40th Rd
- 3003 40th Ave
- 3937 30th St
- 3937 30th St
- 3937 30th St
- 30-02 39th Ave Unit A715
- 30-02 39th Ave Unit A-707
- 30-02 39th Ave Unit C309
- 3002 39th Ave Unit B208
- 3002 39th Ave Unit A 120
- 3002 39th Ave Unit A-707
- 3002 39th Ave Unit C309
- 3002 39th Ave
- 3002 39th Ave Unit B-514