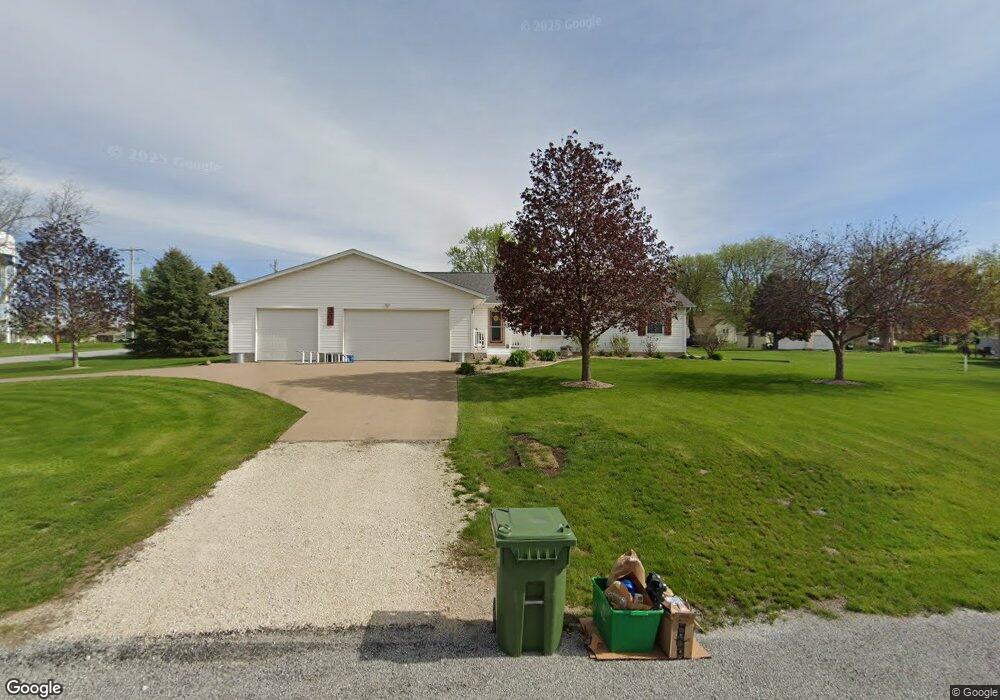
302 2nd St Durant, IA 52747
Estimated Value: $257,000 - $286,354
3
Beds
2
Baths
1,375
Sq Ft
$202/Sq Ft
Est. Value
About This Home
This home is located at 302 2nd St, Durant, IA 52747 and is currently estimated at $277,839, approximately $202 per square foot. 302 2nd St is a home located in Cedar County with nearby schools including Durant Elementary School and Durant High School.
Ownership History
Date
Name
Owned For
Owner Type
Purchase Details
Closed on
Apr 15, 2021
Sold by
Weyrick Orville E and Weyrick Donna S
Bought by
Otto Jeffery A and Smith Wendy L
Current Estimated Value
Home Financials for this Owner
Home Financials are based on the most recent Mortgage that was taken out on this home.
Original Mortgage
$240,000
Interest Rate
3%
Mortgage Type
Construction
Purchase Details
Closed on
Aug 30, 2013
Sold by
Tompkins Paul E and Tompkins Betty J
Bought by
Weyrick Orville E and Weyrick Donna S
Create a Home Valuation Report for This Property
The Home Valuation Report is an in-depth analysis detailing your home's value as well as a comparison with similar homes in the area
Purchase History
| Date | Buyer | Sale Price | Title Company |
|---|---|---|---|
| Otto Jeffery A | $524,375 | None Listed On Document | |
| Weyrick Orville E | $173,500 | None Available |
Source: Public Records
Mortgage History
| Date | Status | Borrower | Loan Amount |
|---|---|---|---|
| Closed | Otto Jeffery A | $240,000 | |
| Closed | Otto Jeffery A | $240,000 |
Source: Public Records
Tax History
| Year | Tax Paid | Tax Assessment Tax Assessment Total Assessment is a certain percentage of the fair market value that is determined by local assessors to be the total taxable value of land and additions on the property. | Land | Improvement |
|---|---|---|---|---|
| 2025 | $4,426 | $276,630 | $44,060 | $232,570 |
| 2024 | $4,426 | $278,390 | $44,060 | $234,330 |
| 2023 | $4,188 | $267,030 | $44,060 | $222,970 |
| 2022 | $3,256 | $202,280 | $32,310 | $169,970 |
| 2021 | $3,376 | $202,280 | $32,310 | $169,970 |
| 2020 | $3,376 | $193,780 | $32,310 | $161,470 |
| 2019 | $3,512 | $193,360 | $32,310 | $161,470 |
| 2018 | $3,376 | $193,360 | $0 | $0 |
| 2017 | $3,098 | $174,590 | $0 | $0 |
| 2016 | $3,290 | $174,590 | $0 | $0 |
| 2015 | $3,272 | $171,660 | $0 | $0 |
| 2014 | $3,046 | $166,280 | $0 | $0 |
Source: Public Records
Map
Nearby Homes
Your Personal Tour Guide
Ask me questions while you tour the home.