302 Beale St Quincy, MA 02170
West Quincy NeighborhoodEstimated Value: $1,119,000 - $1,475,118
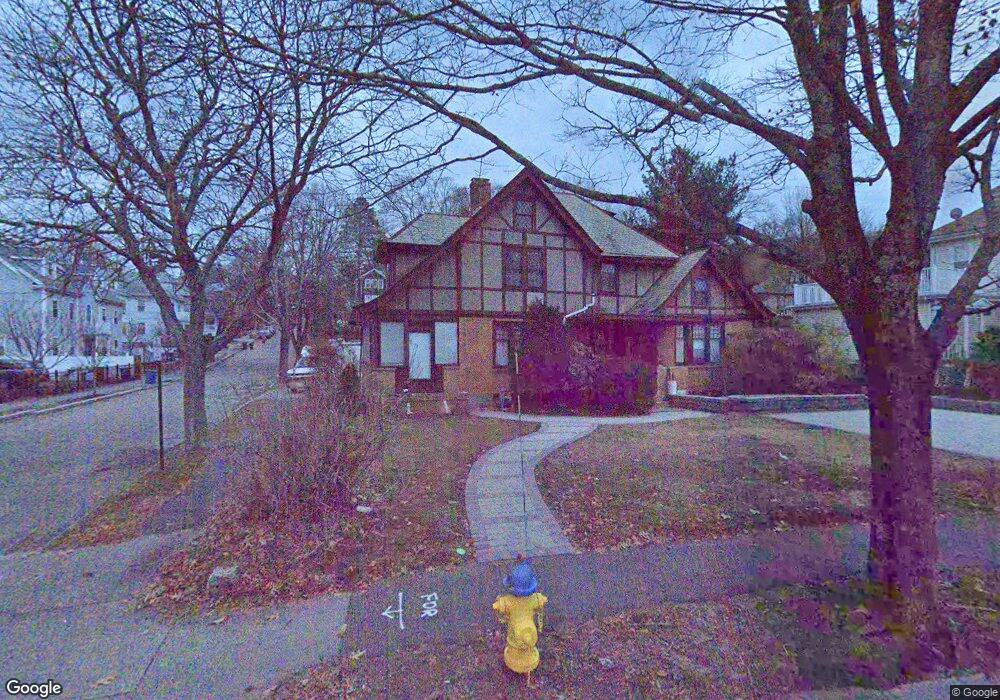
About This Home
This home is located at 302 Beale St, Quincy, MA 02170 and is currently estimated at $1,281,530, approximately $322 per square foot. 302 Beale St is a home located in Norfolk County with nearby schools including Wollaston School, Central Middle School, and North Quincy High School.
Ownership History
We collect this data history from publicly available records. To have your information removed, we recommend requesting removal directly through your county’s website.
Purchase Details
Home Financials for this Owner
Home Financials are based on the most recent Mortgage that was taken out on this home.Home Values in the Area
Average Home Value in this Area
Purchase History
We collect this data history from publicly available records. To have your information removed, we recommend requesting removal directly through your county’s website.
| Date | Buyer | Sale Price | Title Company |
|---|---|---|---|
| $460,000 | -- |
Mortgage History
We collect this data history from publicly available records. To have your information removed, we recommend requesting removal directly through your county’s website.
| Date | Status | Borrower | Loan Amount |
|---|---|---|---|
| Open | $368,000 |
Tax History
We collect this data history from publicly available records. To have your information removed, we recommend requesting removal directly through your county’s website.
| Year | Tax Paid | Tax Assessment Tax Assessment Total Assessment is a certain percentage of the fair market value that is determined by local assessors to be the total taxable value of land and additions on the property. | Land | Improvement |
|---|---|---|---|---|
| 2025 | $14,426 | $1,251,200 | $384,700 | $866,500 |
| 2024 | $13,775 | $1,222,300 | $384,700 | $837,600 |
| 2023 | $13,307 | $1,195,600 | $366,500 | $829,100 |
| 2022 | $15,727 | $1,312,800 | $293,500 | $1,019,300 |
| 2021 | $10,409 | $857,400 | $293,500 | $563,900 |
| 2020 | $9,994 | $804,000 | $293,500 | $510,500 |
| 2019 | $9,471 | $754,700 | $274,400 | $480,300 |
| 2018 | $9,617 | $720,900 | $249,600 | $471,300 |
| 2017 | $9,874 | $696,800 | $249,600 | $447,200 |
| 2016 | $9,446 | $657,800 | $227,000 | $430,800 |
| 2015 | $8,957 | $613,500 | $206,500 | $407,000 |
| 2014 | $7,651 | $514,900 | $122,900 | $392,000 |
Map
- 169 Pine St
- 30 Hillside Ave
- 33 Bishop Rd Unit 33
- 157 Beale St Unit 6
- 157 Beale St Unit 1
- 267-269 Farrington St
- 73 Washington St
- 128 Prospect Ave
- 24 Victory Ave
- 251 Newport Ave
- 135 Safford St
- 245 Newport Ave
- 87 Dewson Rd
- 40 Shirley St
- 635 Adams St
- 17 Duggan Ln
- 13 Wentworth Rd Unit 303
- 45 Foster Ln
- 45 Oval Rd Unit 34
- 45 Oval Rd Unit 8
- 295 Beale St
- 297 Beale St
- 297 Beale St Unit 1
- 196 Norfolk St
- 291 Beale St
- 190 Norfolk St
- 190 Norfolk St Unit 2
- 303 Beale St
- 283 Beale St
- 285 Beale St Unit 2
- 285 Beale St Unit 1
- 283 Beale St Unit 1
- 283 Beale St Unit 2
- 292 Beale St
- 305 Beale St
- 186 Norfolk St
- 304 Beale St Unit 1
- 304 Beale St
- 189 Norfolk St
- 220 Norfolk St
Ask me questions while you tour the home.