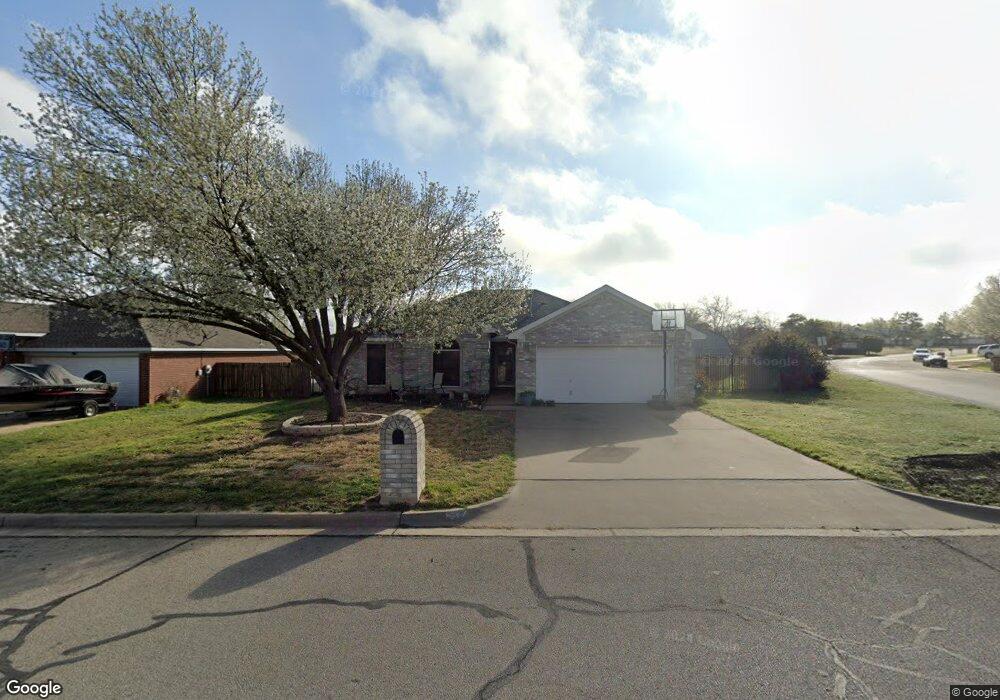
302 Beaumont Dr Weatherford, TX 76086
Estimated Value: $307,407 - $323,000
3
Beds
2
Baths
1,692
Sq Ft
$186/Sq Ft
Est. Value
About This Home
This home is located at 302 Beaumont Dr, Weatherford, TX 76086 and is currently estimated at $314,352, approximately $185 per square foot. 302 Beaumont Dr is a home located in Parker County with nearby schools including Crockett Elementary School, Tison Middle School, and Weatherford High School.
Ownership History
Date
Name
Owned For
Owner Type
Purchase Details
Closed on
Sep 6, 2016
Sold by
Bonneau Donald Thomas and Bonneau Linda
Bought by
Marcantonio Tresta
Current Estimated Value
Purchase Details
Closed on
Apr 8, 2014
Bought by
Marcantonio Tresta
Purchase Details
Closed on
Mar 27, 2014
Sold by
Cartus Financial Corporation
Bought by
Bennett Donald Thomas
Purchase Details
Closed on
Jan 3, 2014
Sold by
Hoffman Jacob Paul and Hoffman Scott
Bought by
Cartus Financial Corporation
Purchase Details
Closed on
Feb 27, 2002
Sold by
Choice Homes Inc
Bought by
Marcantonio Tresta
Purchase Details
Closed on
Jan 2, 2002
Sold by
Choice Homes Texas Inc
Bought by
Marcantonio Tresta
Purchase Details
Closed on
Dec 21, 1998
Sold by
Sweetwater Land & Cattle Co Lt
Bought by
Marcantonio Tresta
Create a Home Valuation Report for This Property
The Home Valuation Report is an in-depth analysis detailing your home's value as well as a comparison with similar homes in the area
Home Values in the Area
Average Home Value in this Area
Purchase History
| Date | Buyer | Sale Price | Title Company |
|---|---|---|---|
| Marcantonio Tresta | -- | Providence Title Company | |
| Marcantonio Tresta | -- | -- | |
| Bennett Donald Thomas | -- | Providence Title Company | |
| Cartus Financial Corporation | -- | Providence Title Company | |
| Marcantonio Tresta | -- | -- | |
| Marcantonio Tresta | -- | -- | |
| Marcantonio Tresta | -- | -- |
Source: Public Records
Tax History Compared to Growth
Tax History
| Year | Tax Paid | Tax Assessment Tax Assessment Total Assessment is a certain percentage of the fair market value that is determined by local assessors to be the total taxable value of land and additions on the property. | Land | Improvement |
|---|---|---|---|---|
| 2025 | $3,828 | $277,598 | -- | -- |
| 2024 | $3,828 | $252,362 | -- | -- |
| 2023 | $3,828 | $229,420 | $0 | $0 |
| 2022 | $4,626 | $208,570 | $20,000 | $188,570 |
| 2021 | $4,802 | $208,570 | $20,000 | $188,570 |
| 2020 | $4,392 | $181,780 | $20,000 | $161,780 |
| 2019 | $4,287 | $181,780 | $20,000 | $161,780 |
| 2018 | $3,915 | $152,610 | $20,000 | $132,610 |
| 2017 | $4,016 | $152,610 | $20,000 | $132,610 |
| 2016 | $3,559 | $135,270 | $20,000 | $115,270 |
| 2015 | $3,486 | $135,270 | $20,000 | $115,270 |
| 2014 | $2,811 | $120,260 | $20,000 | $100,260 |
Source: Public Records
Map
Nearby Homes
- 509 Sweetwater Dr
- 1609 Dicey Rd
- 522 Crow Ave
- Horseshoe Bend Rd
- 0 Adell Cir
- 107 Hickory Ln
- 110 Pine St
- The Chisholm Plan at Hickory Place Addition
- 305 Hickory Ln
- 1917 Windowmere Trail
- 905 Terry Trail
- 214 Cedar St
- 307 Hickory Ln
- 249 Wandering Ln
- 228 Allen St
- 309 De la Cruz St
- 101 Meadow Ct
- 313 De la Cruz St
- 214 Willow Creek Dr
- 2113-A Dicey Rd
- 306 Beaumont Dr
- 310 Beaumont Dr
- 302 Sweetwater Dr
- 314 Beaumont Dr
- 306 Sweetwater Dr
- 301 Sweetwater Dr
- 211 Sweetwater Dr
- 305 Alpine Dr
- 305 Sweetwater Dr
- 318 Beaumont Dr
- 310 Sweetwater Dr
- 207 Sweetwater Dr
- 205 Sweetwater Dr
- 309 Alpine Dr
- 302 Alpine Dr
- 306 Alpine Dr
- 130 Coyote Run
- 309 Sweetwater Dr
- 322 Beaumont Dr
- 314 Sweetwater Dr