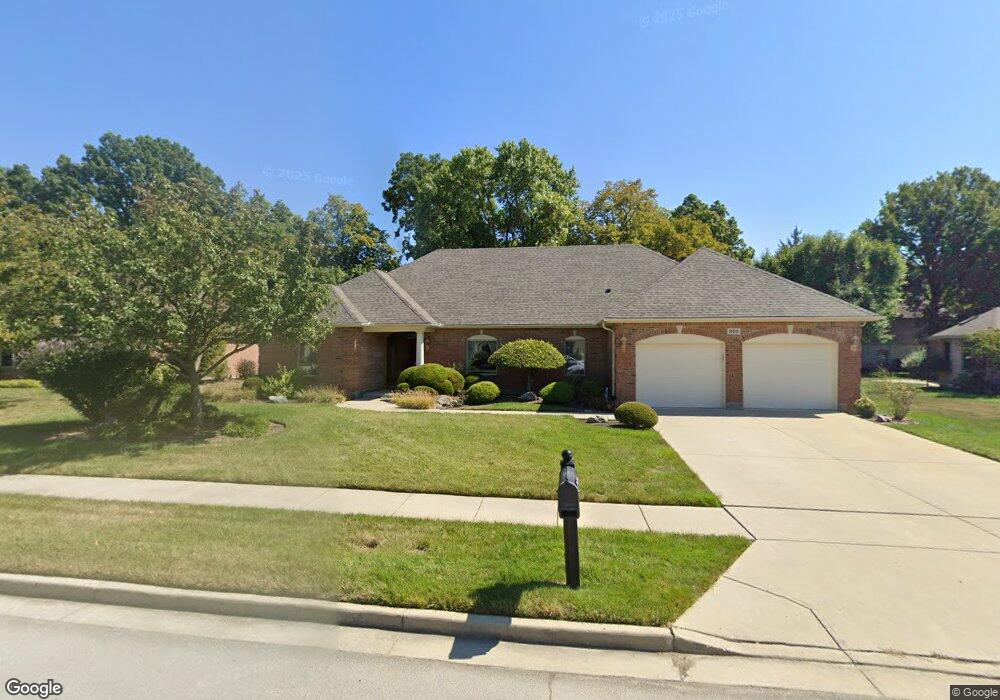
302 Chinkapin Cir Clayton, OH 45315
Estimated Value: $397,850 - $429,000
3
Beds
3
Baths
2,615
Sq Ft
$158/Sq Ft
Est. Value
About This Home
This home is located at 302 Chinkapin Cir, Clayton, OH 45315 and is currently estimated at $412,463, approximately $157 per square foot. 302 Chinkapin Cir is a home located in Montgomery County with nearby schools including Englewood Hills Elementary School, Northmont High School, and Trotwood Preparatory & Fitness Academy.
Ownership History
Date
Name
Owned For
Owner Type
Purchase Details
Closed on
Nov 7, 2016
Sold by
Bayless John R
Bought by
Holmes Jim J and Holmes Linda
Current Estimated Value
Home Financials for this Owner
Home Financials are based on the most recent Mortgage that was taken out on this home.
Original Mortgage
$196,000
Outstanding Balance
$157,354
Interest Rate
3.42%
Mortgage Type
New Conventional
Estimated Equity
$255,109
Purchase Details
Closed on
May 29, 2009
Sold by
Potter Stephen L and Potter Denise M
Bought by
Bayless John R
Home Financials for this Owner
Home Financials are based on the most recent Mortgage that was taken out on this home.
Original Mortgage
$218,500
Interest Rate
4.85%
Mortgage Type
Purchase Money Mortgage
Purchase Details
Closed on
Apr 26, 2004
Sold by
Artistic Homes Inc
Bought by
Potter Stephen L and Potter Denise M
Home Financials for this Owner
Home Financials are based on the most recent Mortgage that was taken out on this home.
Original Mortgage
$251,750
Interest Rate
4.75%
Mortgage Type
Construction
Purchase Details
Closed on
May 28, 2003
Sold by
Deeter Bruce and Deeter David
Bought by
G & K Investments
Create a Home Valuation Report for This Property
The Home Valuation Report is an in-depth analysis detailing your home's value as well as a comparison with similar homes in the area
Home Values in the Area
Average Home Value in this Area
Purchase History
| Date | Buyer | Sale Price | Title Company |
|---|---|---|---|
| Holmes Jim J | $245,000 | Sterling Title Inc | |
| Bayless John R | $249,900 | Attorney | |
| Potter Stephen L | $47,500 | -- | |
| G & K Investments | -- | Landmark Title |
Source: Public Records
Mortgage History
| Date | Status | Borrower | Loan Amount |
|---|---|---|---|
| Open | Holmes Jim J | $196,000 | |
| Closed | Bayless John R | $218,500 | |
| Previous Owner | Potter Stephen L | $251,750 |
Source: Public Records
Tax History Compared to Growth
Tax History
| Year | Tax Paid | Tax Assessment Tax Assessment Total Assessment is a certain percentage of the fair market value that is determined by local assessors to be the total taxable value of land and additions on the property. | Land | Improvement |
|---|---|---|---|---|
| 2024 | $6,917 | $121,640 | $19,850 | $101,790 |
| 2023 | $6,917 | $121,640 | $19,850 | $101,790 |
| 2022 | $6,648 | $90,020 | $14,700 | $75,320 |
| 2021 | $6,668 | $90,020 | $14,700 | $75,320 |
| 2020 | $6,547 | $90,020 | $14,700 | $75,320 |
| 2019 | $6,317 | $77,920 | $14,700 | $63,220 |
| 2018 | $6,202 | $77,920 | $14,700 | $63,220 |
| 2017 | $6,137 | $77,920 | $14,700 | $63,220 |
| 2016 | $5,883 | $73,400 | $14,700 | $58,700 |
| 2015 | $5,376 | $73,400 | $14,700 | $58,700 |
| 2014 | $5,376 | $73,400 | $14,700 | $58,700 |
| 2012 | -- | $89,120 | $19,250 | $69,870 |
Source: Public Records
Map
Nearby Homes
- 306 Pauly Dr
- 4245 W Wenger Rd
- 108 Denwood Trail
- 900 Moonlight Dr
- 830 W Wenger Rd
- 250 Winter Creek Ct
- 881 Sunset Dr
- 534 Unger Ave
- 1003 Sunset Dr
- 206 Gardengrove Way
- 510 Rohr Ln
- 206 Lodestone Dr
- 604 Heather St
- 505 Durst Dr
- 510 Lambert Ln
- 408 W Herr St
- 109 Silverstone Dr
- 803 Albert St
- 104 Silverstone Dr
- 607 Albert St
- 164 Deeter Dr
- 304 Chinkapin Cir
- 1 Deeter Dr
- 0 Deeter Unit 497405
- 0 Deeter Unit 497406
- 0 Deeter Unit 327689
- 0 Deeter Unit 327686
- 212 Denwood Trail
- 321 Shady Tree Ct
- 319 Shady Tree Ct
- 306 Chinkapin Cir
- 303 Chinkapin Cir
- 305 Chinkapin Ct
- 305 Chinkapin Cir
- 222 Denwood Trail
- 210 Denwood Trail
- 215 Denwood Trail
- 317 Shady Tree Ct
- 320 Shady Tree Ct
- 307 Chinkapin Cir