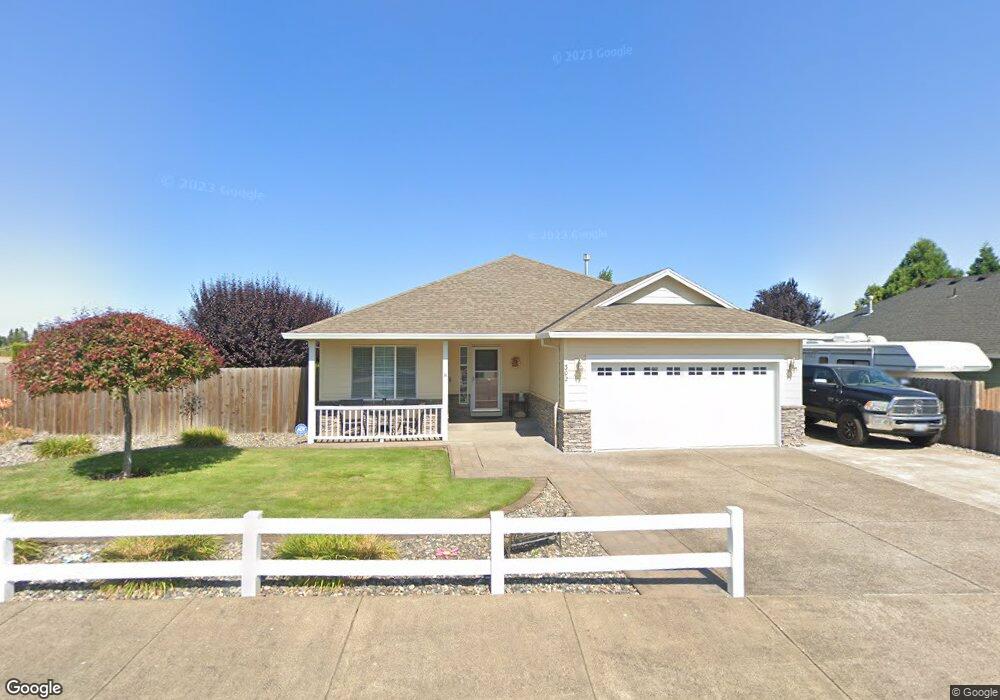
302 Chinook St Molalla, OR 97038
Estimated Value: $490,846 - $542,000
3
Beds
2
Baths
1,615
Sq Ft
$318/Sq Ft
Est. Value
About This Home
This home is located at 302 Chinook St, Molalla, OR 97038 and is currently estimated at $514,212, approximately $318 per square foot. 302 Chinook St is a home located in Clackamas County with nearby schools including Molalla River Academy, Country Christian School, and Oregon Outreach - Molalla Pride.
Ownership History
Date
Name
Owned For
Owner Type
Purchase Details
Closed on
Apr 8, 2009
Sold by
Lafayette Nancy J
Bought by
Lafayette Nancy J and Lafayette Family Living Trust
Current Estimated Value
Purchase Details
Closed on
Oct 16, 2008
Sold by
Estheimer John S and Estheimer Kristine C
Bought by
Lafayette Nancy J
Home Financials for this Owner
Home Financials are based on the most recent Mortgage that was taken out on this home.
Original Mortgage
$75,000
Outstanding Balance
$48,059
Interest Rate
5.77%
Mortgage Type
Purchase Money Mortgage
Estimated Equity
$466,153
Purchase Details
Closed on
Jun 23, 2004
Sold by
Noble Crest Homes Inc
Bought by
Estheimer John S and Estheimer Kristine C
Home Financials for this Owner
Home Financials are based on the most recent Mortgage that was taken out on this home.
Original Mortgage
$93,950
Interest Rate
6.29%
Mortgage Type
Purchase Money Mortgage
Create a Home Valuation Report for This Property
The Home Valuation Report is an in-depth analysis detailing your home's value as well as a comparison with similar homes in the area
Home Values in the Area
Average Home Value in this Area
Purchase History
| Date | Buyer | Sale Price | Title Company |
|---|---|---|---|
| Lafayette Nancy J | -- | None Available | |
| Lafayette Nancy J | $245,000 | Fidelity Natl Title Co Of Or | |
| Estheimer John S | $183,950 | Chicago Title Insurance Co |
Source: Public Records
Mortgage History
| Date | Status | Borrower | Loan Amount |
|---|---|---|---|
| Open | Lafayette Nancy J | $75,000 | |
| Previous Owner | Estheimer John S | $93,950 |
Source: Public Records
Tax History Compared to Growth
Tax History
| Year | Tax Paid | Tax Assessment Tax Assessment Total Assessment is a certain percentage of the fair market value that is determined by local assessors to be the total taxable value of land and additions on the property. | Land | Improvement |
|---|---|---|---|---|
| 2025 | $4,728 | $246,810 | -- | -- |
| 2024 | $4,570 | $239,622 | -- | -- |
| 2023 | $4,570 | $232,643 | $0 | $0 |
| 2022 | $3,768 | $225,867 | $0 | $0 |
| 2021 | $3,614 | $219,289 | $0 | $0 |
| 2020 | $3,513 | $212,902 | $0 | $0 |
| 2019 | $3,411 | $206,701 | $0 | $0 |
| 2018 | $3,315 | $200,681 | $0 | $0 |
| 2017 | $3,179 | $194,836 | $0 | $0 |
| 2016 | $3,014 | $189,161 | $0 | $0 |
| 2015 | $2,928 | $183,651 | $0 | $0 |
| 2014 | $2,837 | $178,302 | $0 | $0 |
Source: Public Records
Map
Nearby Homes
- 704 Patrol St
- 15160 S Highway 211
- 122 N Cole Ave
- 207 Finneys Ave
- 820 E 3rd St
- 218 Finneys Ave
- 619 E Heintz St
- 162 Fenton Ave Unit C
- 821 E 7th St
- 123 Shirley St
- 225 N Molalla Ave
- 118 Engle Ave
- 121 W Ross St
- 206 S Molalla Ave
- 416 Kennel Ave
- 3 Revilot Ct
- 208 W Heintz St Unit 2
- 205 W Heintz St Unit 708
- 227 Hauser Ct
- 15706 S Highway 211