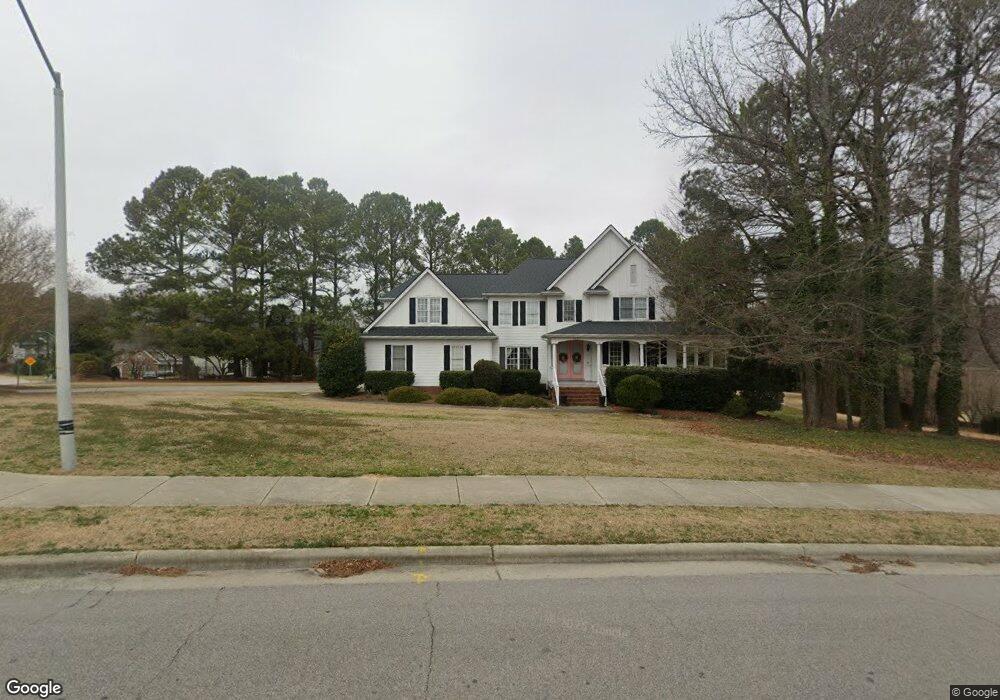
302 Circle On the Green Cary, NC 27519
Preston NeighborhoodEstimated Value: $1,251,000 - $1,368,000
4
Beds
4
Baths
3,444
Sq Ft
$378/Sq Ft
Est. Value
About This Home
This home is located at 302 Circle On the Green, Cary, NC 27519 and is currently estimated at $1,300,965, approximately $377 per square foot. 302 Circle On the Green is a home located in Wake County with nearby schools including Green Hope Elementary, Davis Drive Middle, and Green Hope High.
Ownership History
Date
Name
Owned For
Owner Type
Purchase Details
Closed on
May 3, 2005
Sold by
Papsidero Frank W
Bought by
Stanley Robert L and Stanley Colleen W
Current Estimated Value
Home Financials for this Owner
Home Financials are based on the most recent Mortgage that was taken out on this home.
Original Mortgage
$357,000
Outstanding Balance
$184,945
Interest Rate
5.74%
Mortgage Type
Fannie Mae Freddie Mac
Estimated Equity
$1,116,020
Purchase Details
Closed on
Feb 22, 2000
Sold by
Landmark Homes Inc
Bought by
Papsidero Frank W and Papsidero Peggy J
Home Financials for this Owner
Home Financials are based on the most recent Mortgage that was taken out on this home.
Original Mortgage
$175,000
Interest Rate
8.14%
Mortgage Type
Stand Alone First
Purchase Details
Closed on
Sep 29, 1999
Sold by
Sas Institute Inc
Bought by
Solaris Development Corp and Sunstar Homes
Create a Home Valuation Report for This Property
The Home Valuation Report is an in-depth analysis detailing your home's value as well as a comparison with similar homes in the area
Home Values in the Area
Average Home Value in this Area
Purchase History
| Date | Buyer | Sale Price | Title Company |
|---|---|---|---|
| Stanley Robert L | $547,500 | -- | |
| Papsidero Frank W | $435,000 | -- | |
| Solaris Development Corp | $75,000 | -- |
Source: Public Records
Mortgage History
| Date | Status | Borrower | Loan Amount |
|---|---|---|---|
| Open | Stanley Robert L | $357,000 | |
| Previous Owner | Papsidero Frank W | $175,000 |
Source: Public Records
Tax History Compared to Growth
Tax History
| Year | Tax Paid | Tax Assessment Tax Assessment Total Assessment is a certain percentage of the fair market value that is determined by local assessors to be the total taxable value of land and additions on the property. | Land | Improvement |
|---|---|---|---|---|
| 2025 | $9,451 | $1,100,384 | $325,000 | $775,384 |
| 2024 | $9,247 | $1,100,384 | $325,000 | $775,384 |
| 2023 | $7,635 | $759,968 | $183,000 | $576,968 |
| 2022 | $7,350 | $759,968 | $183,000 | $576,968 |
| 2021 | $7,202 | $759,968 | $183,000 | $576,968 |
| 2020 | $7,240 | $759,968 | $183,000 | $576,968 |
| 2019 | $6,892 | $641,815 | $168,000 | $473,815 |
| 2018 | $6,466 | $641,815 | $168,000 | $473,815 |
| 2017 | $6,214 | $641,815 | $168,000 | $473,815 |
| 2016 | $6,120 | $641,815 | $168,000 | $473,815 |
| 2015 | $6,055 | $612,952 | $152,000 | $460,952 |
| 2014 | $5,708 | $612,952 | $152,000 | $460,952 |
Source: Public Records
Map
Nearby Homes
- 205 Benwell Ct
- 121 Goldenthal Ct
- 107 Ackworth Ct
- 408 Indian Elm Ln
- 204 Indian Elm Ln
- 102 Revere Forest Ct
- 217 Preston Retreat Ln
- 107 Badin Lake Ct
- 106 Lake Tillery Dr
- 105 Rockport Ridge Way
- 113 Beeley Ct
- 104 Ashmore Dr
- 104 Deerwalk Ct
- 318 Riggsbee Farm Dr
- 1058 Kingston Grove Dr
- 222 Murray Glen Dr
- 101 Crystal Brook Ln
- 116 Dallavia Ct
- 101 Uplands Creek Dr
- 114 Council Gap Ct
- 302 Circle On the Green
- 300 Circle On the Green
- 300 Circle On the Green
- 100 Chariot
- 100 Chariot Ct
- 104 Chariot Ct
- 106 Chariot Ct
- 101 Circle On the Green
- 103 Clearport Dr
- 200 Circle On the Green
- 200 Circle On the Green
- 301 Preston Village Way
- 102 Clearport Dr
- 101 Chariot Ct
- 110 Chariot Ct
- 101 Chariot
- 105 Clearport Dr
- 106 Circle On the Green
- 105 Beeston Ct
- 106 Circle On the Green