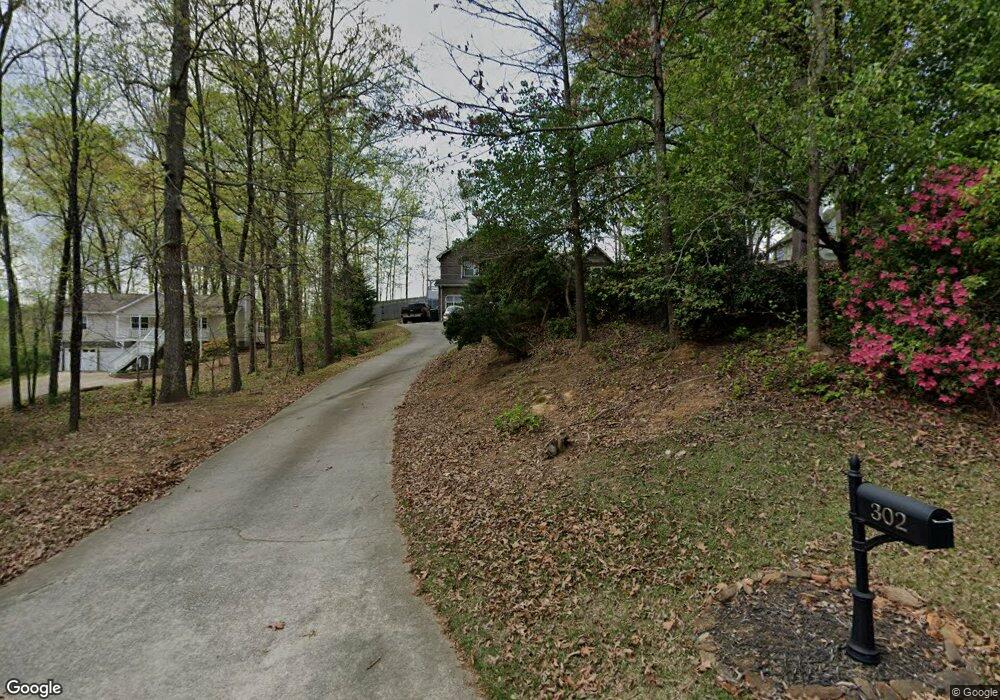
302 Corley Cir Hiram, GA 30141
East Paulding County NeighborhoodEstimated Value: $264,000 - $314,000
2
Beds
2
Baths
1,556
Sq Ft
$187/Sq Ft
Est. Value
About This Home
This home is located at 302 Corley Cir, Hiram, GA 30141 and is currently estimated at $290,244, approximately $186 per square foot. 302 Corley Cir is a home located in Paulding County with nearby schools including Mcgarity Elementary School, P. B. Ritch Middle School, and East Paulding High School.
Ownership History
Date
Name
Owned For
Owner Type
Purchase Details
Closed on
Dec 13, 2019
Sold by
Raybon Virgina
Bought by
Pope Virginia A and Pope Jason F
Current Estimated Value
Home Financials for this Owner
Home Financials are based on the most recent Mortgage that was taken out on this home.
Original Mortgage
$139,000
Outstanding Balance
$122,788
Interest Rate
3.7%
Mortgage Type
New Conventional
Estimated Equity
$167,456
Purchase Details
Closed on
Apr 12, 2016
Sold by
Caruso Darlene Ann Estate
Bought by
Raybon Virginia
Home Financials for this Owner
Home Financials are based on the most recent Mortgage that was taken out on this home.
Original Mortgage
$93,921
Interest Rate
4.25%
Mortgage Type
FHA
Purchase Details
Closed on
Dec 29, 1999
Sold by
Park Michael H and Park Margaret E
Bought by
Caruso Darlene A
Home Financials for this Owner
Home Financials are based on the most recent Mortgage that was taken out on this home.
Original Mortgage
$83,200
Interest Rate
8.11%
Mortgage Type
New Conventional
Create a Home Valuation Report for This Property
The Home Valuation Report is an in-depth analysis detailing your home's value as well as a comparison with similar homes in the area
Home Values in the Area
Average Home Value in this Area
Purchase History
| Date | Buyer | Sale Price | Title Company |
|---|---|---|---|
| Pope Virginia A | -- | -- | |
| Raybon Virginia | $96,000 | -- | |
| Caruso Darlene A | $104,000 | -- |
Source: Public Records
Mortgage History
| Date | Status | Borrower | Loan Amount |
|---|---|---|---|
| Open | Pope Virginia A | $139,000 | |
| Previous Owner | Raybon Virginia | $93,921 | |
| Previous Owner | Caruso Darlene A | $83,200 |
Source: Public Records
Tax History Compared to Growth
Tax History
| Year | Tax Paid | Tax Assessment Tax Assessment Total Assessment is a certain percentage of the fair market value that is determined by local assessors to be the total taxable value of land and additions on the property. | Land | Improvement |
|---|---|---|---|---|
| 2024 | $2,821 | $116,644 | $12,000 | $104,644 |
| 2023 | $3,179 | $124,468 | $12,000 | $112,468 |
| 2022 | $3,011 | $117,364 | $12,000 | $105,364 |
| 2021 | $2,528 | $88,868 | $8,000 | $80,868 |
| 2020 | $2,225 | $76,768 | $8,000 | $68,768 |
| 2019 | $2,024 | $69,024 | $8,000 | $61,024 |
| 2018 | $1,893 | $64,708 | $8,000 | $56,708 |
| 2017 | $1,116 | $64,056 | $8,000 | $56,056 |
| 2016 | $1,918 | $65,308 | $8,000 | $57,308 |
| 2015 | $1,722 | $57,792 | $8,000 | $49,792 |
| 2014 | $1,537 | $50,548 | $8,000 | $42,548 |
| 2013 | -- | $36,880 | $8,000 | $28,880 |
Source: Public Records
Map
Nearby Homes
- 1 Corley Cir
- 0 Old Mill Rd Unit 7632177
- 0 Old Mill Rd Unit 10569938
- 608 Barnfield Way
- 580 Barnfield Way
- 568 Barnfield Way
- 80 Indian Lake Dr
- 98 Pace Dr
- 517 Barnfield Way
- 507 Barnfield Way
- Boylston Plan at Old Mill Preserve
- Kittridge Plan at Old Mill Preserve
- Pendula Plan at Old Mill Preserve
- Wellton Plan at Old Mill Preserve
- Anglewood Plan at Old Mill Preserve
- 0 MacLand Mill Dr Unit 10576487
- 0 MacLand Mill Dr Unit 25806576
- 295 Hiram Acworth Hwy
- 150 Hiram Terrace
- 3278 MacLand Rd
- 276 Corley Cir
- 166 5 Oaks Dr
- 154 Five Oaks Dr Unit 23
- 154 Five Oaks Dr
- 188 5 Oaks Dr
- 260 Corley Cir
- 311 Corley Cir
- 144 Five Oaks Dr
- 202 5 Oaks Dr
- 202 Five Oaks Dr
- 215 Corley Cir
- 30 Corley Ct
- 340 Corley Cir
- 323 Corley Cir
- 246 Corley Cir
- 218 Five Oaks Dr
- 218 Five Oaks Dr Unit 19
- 132 5 Oaks Dr
- 159 Five Oaks Dr
- 159 Five Oaks Dr Unit 8